python办公自动化练习——体温
目录
一、题目描述
二、效果展示
三、源码展示
四、分析
1、获取工作簿对象
2、创建工作表对象
3、读取excel表中的数据
4、将表头写入工作表
5、将数据写入工作表
6、体温样式
7、状态标识
一、题目描述
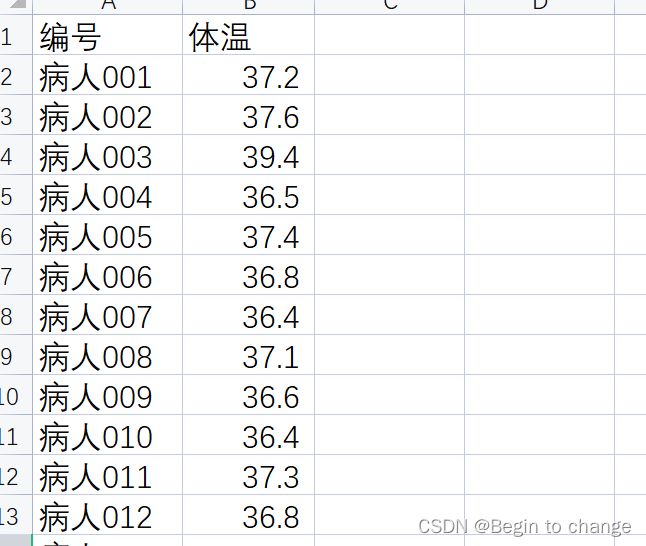
对体温测量登记表中的数据筛选处理,将体温不正常的数据用颜色填充,以及显示体温的状态。
二、效果展示
三、源码展示
import xlwt
import xlrd

# 根据体温设置背景颜色


def get_temp_status(temp):

    if temp < 37.2:
        status = '正常'
    elif temp < 38.5:
        status = '发热'
    else:
        status = '高热'

    return status


def get_temp_style(temp):
    style = xlwt.XFStyle()
    pattern = xlwt.Pattern()
    pattern.pattern = xlwt.Pattern.SOLID_PATTERN

    if temp < 37.2:
        pattern.pattern_fore_colour = xlwt.Style.colour_map['green']
    elif temp < 38.5:
        pattern.pattern_fore_colour = xlwt.Style.colour_map['orange']
    else:
        pattern.pattern_fore_colour = xlwt.Style.colour_map['red']

    style.pattern = pattern

    return style


def main():
    wb = xlrd.open_workbook('体温测量登记表.xls')#获取工作簿对象
    sheet1 = wb.sheet_by_index(0)#通过下标索引创建一个工作表对象

    data = []

    for row in range(1, sheet1.nrows):
        record = []
        for col in range(sheet1.ncols):
            record.append(sheet1.cell(row, col).value)
        data.append(record)

    wb2 = xlwt.Workbook()#创建一个写的工作簿对象
    sheet2 = wb2.add_sheet('带颜色标记的体温测量登记表')
    sheet2.write(0, 0, '姓名')
    sheet2.write(0, 1, '体温')
    sheet2.write(0, 2, '状态')

    count = 0
    for index, record in enumerate(data):
        num, temp = record
        if temp >= 37.2:
            count += 1
        sheet2.write(index + 1, 0, num)
        sheet2.write(index + 1, 1, temp, get_temp_style(temp))
        sheet2.write(index + 1, 2, get_temp_status(temp))
    sheet2.write(102, 0, '总人数')
    sheet2.write(102, 1, f'{len(data)}人')
    sheet2.write(103, 0, '异常人数')
    sheet2.write(103, 1, f'{count}人')

    wb2.save('体温测量登记表_最全.xls')


if __name__ == "__main__":
    main()
四、分析
1、获取工作簿对象
wb = xlrd.open_workbook('体温测量登记表.xls')#获取工作簿对象2、创建工作表对象
sheet1 = wb.sheet_by_index(0)#通过下标索引创建一个工作表对象3、读取excel表中的数据
可以将excel表中的数据看做是二维的数组(python中称为列表),先读取第一行的每一列,然后依次的读取每一行,也就是用到两个for循环去实现,python对应的就是列表了,将一行的数据存储到一维的列表中,然后再将列表存储到列表中,就形成了二维的列表。
data = []

    for row in range(1, sheet1.nrows):
        record = []
        for col in range(sheet1.ncols):
            record.append(sheet1.cell(row, col).value)
        data.append(record)
4、将表头写入工作表
  sheet2 = wb2.add_sheet('带颜色标记的体温测量登记表')
    sheet2.write(0, 0, '姓名')#第0行的第0列写入姓名
    sheet2.write(0, 1, '体温')#第0行第一列写入体温
    sheet2.write(0, 2, '状态')#第0行第二列写入状态

#此三处写入就相当于是写表头了
5、将数据写入工作表
之前从excel表中读取数据,现在写到另一个表中,因为不能在源文件上做更改(原数据要保留);
存入的是一个二维列表,取出时用枚举的方法,这样不仅能去到二维列表里面一维列表还能得到它是位于第几位的列表,此时的位置加1就是写入文件的行数,列数就是0,1,2,内容就是姓名、体温、以及状态,但是此处的体温的样式是做了改变的
count = 0
    for index, record in enumerate(data):
        num, temp = record#解包
        if temp >= 37.2:
            count += 1
        sheet2.write(index + 1, 0, num)
        sheet2.write(index + 1, 1, temp, get_temp_style(temp))
        sheet2.write(index + 1, 2, get_temp_status(temp))
6、体温样式
在写Excel文件时,我们还可以为单元格设置样式,主要包括字体(Font)、对齐方式(Alignment)、边框(Border)和背景(Background)的设置,xlwt对这几项设置都封装了对应的类来支持。
要设置单元格样式需要首先创建一个XFStyle对象,再通过该对象的属性对字体、对齐方式、边框等进行设定
对于样式的设置不用了解的很深刻,需要用到的时候套用即可
def get_temp_style(temp):
    style = xlwt.XFStyle()
    pattern = xlwt.Pattern()
    pattern.pattern = xlwt.Pattern.SOLID_PATTERN#填充

    if temp < 37.2:
        pattern.pattern_fore_colour = xlwt.Style.colour_map['green']
#当温度小于37.2度时用绿色填充
    elif temp < 38.5:
        pattern.pattern_fore_colour = xlwt.Style.colour_map['orange']
#温度小于38.5度大于37.2度时用橙色填充
    else:
#小于37.2或者大于38。5的温度用红色填充
        pattern.pattern_fore_colour = xlwt.Style.colour_map['red']

    style.pattern = pattern

    return style#返回样式对象
7、状态标识
这个就相对简单了,就只用根据温度的大小去返回对应的值即可
def get_temp_status(temp):

    if temp < 37.2:
        status = '正常'
    elif temp < 38.5:
        status = '发热'
    else:
        status = '高热'

    return status

