函数调用关系及消耗时间统计——程序概要分析工具gprof
函数调用关系及消耗时间统计——程序概要分析工具gprof
微信公众号:幼儿园的学霸
个人的学习笔记,关于OpenCV,关于机器学习, …。问题或建议,请公众号留言;
目录
文章目录
- 函数调用关系及消耗时间统计——程序概要分析工具gprof
- 目录
- 简介
- 使用方法
- cmake使用gprof
- 数据分析
-
- 文件内容
- 信息说明
- 用户时间与内核时间
- 注意事项
- 参考
简介
GNU gprof能够打印出程序运行中各个函数消耗的时间,可以帮助程序员找出众多函数中耗时最多的函数。产生程序运行时候的函数调用关系,包括调用次数,可以帮助程序员分析程序的运行流程。
使用方法
假设我生成一个可执行文件ADAS_usbCamera
- 编译时添加
-pg命令; - 执行可执行文件,在执行目录下会生成
gmon.out文件,程序运行并“正常”退出后,会生成一个gmon.out文件。也就是说,程序必须是从exit或者return终止的; - 使用命令
gprof ADAS_usbCamera gmon.out,也可以使用gprof ADAS_usbCamera gmon.out > profile.txt将显示内容写入profile.txt文件中
cmake使用gprof
需要在CMakeLists.txt文件中添加如下脚本:
set(CMAKE_CXX_FLAGS "${CMAKE_CXX_FLAGS} -pg")
set(CMAKE_C_FLAGS "${CMAKE_C_FLAGS} -pg")
set(CMAKE_EXE_LINKER_FLAGS "${CMAKE_EXE_LINKER_FLAGS} -pg")
set(CMAKE_SHARED_LINKER_FLAGS "${CMAKE_SHARED_LINKER_FLAGS} -pg")
CMAKE_CXX_FLAGS是C++编译需要的编译参数,CMAKE_C_FLAGS是C编译时的参数。使用者可以根据自己的实际情况删减
如果想执行一行一行的profiling,还需要加入-g编译参数
数据分析
文件内容
打开profile.txt就可以看到分析的结果。通过对结果的分析来改进我们的程序。示例如下:
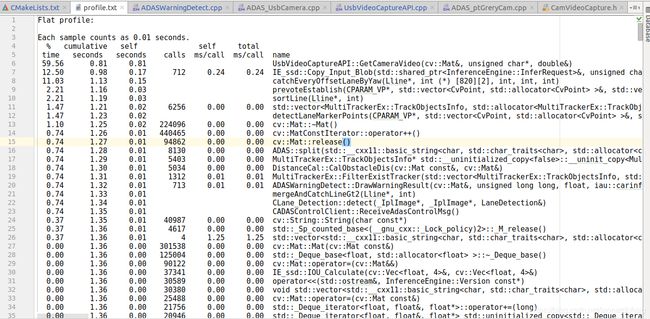
信息说明
gprof产生的信息说明如下:
% time —— the percentage of the total running time of the program used by this function.(函数使用时间占所有时间的百分比。)
cumulative seconds —— a running sum of the number of seconds accounted for by this function and those listed above it.( 函数和上列函数累计执行的时间。)
self seconds —— the number of seconds accounted for by this function alone. This is the major sort for this listing.(函数本身所执行的时间。)
calls —— the number of times this function was invoked, if this function is profiled, else blank.(函数被调用的次数)
self ms /call —— the average number of milliseconds spent in this function per call, if this function is profiled, else blank.(每一次调用花费在函数的时间microseconds。)
total ms/call —— the average number of milliseconds spent in this function and its descendents per call, if this function is profiled, else blank.(每一次调用,花费在函数及其衍生函数的平均时间microseconds。)
name —— the name of the function. This is the minor sort for this listing. The index shows the location of the function in the gprof listing. If the index is in parenthesis it shows where it would appear in the gprof listing if it were to be printed.(函数名)
用户时间与内核时间
gprof的最大缺陷:它只能分析应用程序在运行过程中所消耗掉的用户时间,无法得到程序内核空间的运行时间。通常来说,应用程序在运行时既要花费一些时间来运行用户代码,也要花费一些时间来运行“系统代码”,例如内核系统调用sleep(),则该时间将不进入统计时间中。
有一个方法可以查看应用程序的运行时间组成,那就是time命令。这个命令会显示一个应用程序的实际运行时间、用户空间运行时间、内核空间运行时间。
如time ./ADAS_usbCamera -ad ../configfile/usb_4mm_HD_CameraConfig.yaml
程序退出后,输出结果如下:
real    0m9.093s
user    0m6.684s
sys     0m0.692s
注意事项
- 在编译和链接两个过程,都要使用-pg选项
- 只能使用静态连接libc库,否则在初始化*.so之前就调用profile代码会引起
segmentation fault,解决办法是编译时加上-static-libgcc或-static - gprof只能分析应用程序所消耗掉的用户时间
- gprof不支持多线程应用,多线程下只能采集主线程性能数据。原因是gprof采用ITIMER_PROF信号,在多线程内只有主线程才能响应该信号。但是有一个简单的方法可以解决这一问题:http://sam.zoy.org/writings/programming/gprof.html
- gprof只能在程序正常结束退出之后才能生成报告(gmon.out)。
a)原因:gprof通过在atexit()里注册了一个函数来产生结果信息,任何非正常退出都不会执行atexit()的动作,所以不会产生gmon.out文件。b)程序可从main函数中正常退出,或者通过系统调用exit()函数退出 - …
参考
1.gprof
2.Linux性能评测工具之一:gprof篇
下面的是我的公众号二维码图片,欢迎关注。