pyecharts绘制地图(Geo and Map)(细节更丰富)
pyecharts绘制地图(Geo and Map)(细节更丰富)
- 前言
- 中文官方文档
- 绘制地图Map
- 绘制地理坐标图Geo
- 总结
- 你们可能需要的
前言
前段时间参加了美赛,因为考虑到一些地方要绘制美丽的图表,另外根据往年论文里的内容发现很多时候需要将各国的数据通过世界地图显示出来,所以我就发现了python中的pyecharts库,这篇博客主要分享一下pyecharts中Geo和Map的用法。(这里相较于其他博客的优点可能就是细节更加多一些吧)
中文官方文档
1.文档网址:https://pyecharts.org/#/zh-cn/intro
绘制地图Map
直接上代码
1.由于pyecharts默认输出类型为html文件在网页显示,如果直接在网页中复制图片或者截图的话清晰度会非常差,如果想直接保存为png图片的话可以配置snapshot
from pyecharts.render import make_snapshot
from snapshot_phantomjs import snapshot #这个影响最后输出图片
2.导入相关Map包
from pyecharts.charts import Map #导入地图模块
from pyecharts import options as opts
3.地图显示设置
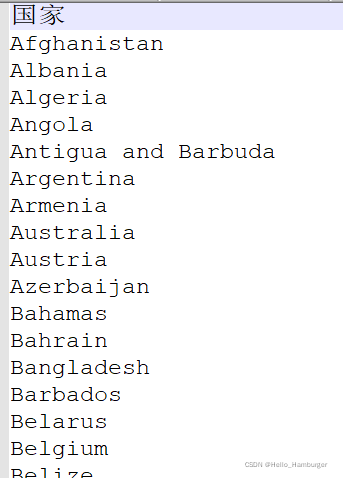
其中.add中的data_pair为元组列表的形式,可以根据情况自行搭建,地图上的话一般都是[(国家1,数值),(国家2,数值),(国家3,数值),…]
worldmap=Map(init_opts=opts.InitOpts(width="800px",height="400px",bg_color='white'))
#初始化地图设置图片大小以及背景颜色
worldmap.add(" ",data_pair=datapairtwo,maptype="world",is_map_symbol_show=False)
#类型为世界地图,is_map_symbol_show可以选择是否显示世界地图上的各个国家的红色标点
worldmap.set_series_opts(label_opts=opts.LabelOpts(is_show=False))
#设置is_show=False,使得世界地图上每个国家的名称不会显示在地图上
worldmap.set_global_opts(title_opts=opts.TitleOpts(title=" "),legend_opts=opts.LegendOpts(is_show=False),
                         visualmap_opts=opts.VisualMapOpts(min_=0,max_=20,orient="horizontal",type_ ="color",
                                                           range_color=['#FCFCFC','#5CACEE','#6495ED'],
                                                           pos_left=360,pos_bottom=60,item_width=15,item_height=80))
#标题设置为空格,即标题不显示,图例设置为不显示,视觉映射范围为0~20,放置为水平放置,视觉映射以颜色变化作为过渡,range_color为颜色变化区间,剩下的设置了视觉映射的位置以及高度宽度,这里主要是抛转引玉,如果还想设置其他的可以根据官方手册进行添加
#worldmap.render("name.html") #网页形式输出
make_snapshot(snapshot,worldmap.render(),"worldfair.png")#图片形式输出
4.为了大家能直观感觉到参数设置的影响,我通过两组代码的输出来展示一下
代码1:
#绘图代码
from pyecharts.charts import Map #导入地图模块
from pyecharts import options as opts
def get_regionname_data(txtadressname):
    alldata=[]
    with open(txtadressname, 'r', encoding='UTF-8') as f:
        lines = f.readlines()# 会自动的将文件按照换行符进行处理将处理好的每一行组成一个列表返回
    for line in lines[1:]:  # 前1行是表头,去掉,这个按照实际情况
        line_info = line.strip()  #删除掉每一行字符串的首尾的空字符
        alldata.append(line_info)
    return alldata
def get_number_data(txtadressname):
    alldata=[]
    with open(txtadressname, 'r', encoding='UTF-8') as f:
        lines = f.readlines()# 会自动的将文件按照换行符进行处理将处理好的每一行组成一个列表返回
    for line in lines[1:]:  # 前1行是表头,去掉,这个按照实际情况
        linshidata=[]
        line_info = line.strip().split()  # 把一行中的字符分开成一个列表,删除掉空行空格
        linshidata=[line_info[0],line_info[1]]
        alldata.append(linshidata)
    return alldata
regionadress="C:\\Users\\86151\\Desktop\\pythonadress.txt"
dataadderss="C:\\Users\\86151\\Desktop\\pythonhuahua.txt"
regionname=get_regionname_data(regionadress)
data=get_number_data(dataadderss)
a_listone=[]
a_listtwo=[]
datapairone=[]
datapairtwo=[]
long=len(regionname)
for i in range(0,long):
    a_listone=[regionname[i],data[i][0]]
    a=tuple(a_listone)
    datapairone.append(a)
    a_listtwo = [regionname[i],data[i][1]]
    b=tuple(a_listtwo)
    datapairtwo.append(b)
#以上部分是为了产生元组列表,大家可以参考
worldmap=Map(init_opts=opts.InitOpts(width="800px",height="400px",bg_color='white'))
worldmap.add(" ",data_pair=datapairtwo,maptype="world",is_map_symbol_show=True)
worldmap.set_series_opts(label_opts=opts.LabelOpts(is_show=True))
worldmap.set_global_opts(title_opts=opts.TitleOpts(title="这里是标题"),legend_opts=opts.LegendOpts(is_show=True),
                        visualmap_opts=opts.VisualMapOpts(min_=0,max_=20,orient="horizontal",type_ ="color",
                                                           range_color=['#FCFCFC','#5CACEE','#6495ED'],
                                                           pos_left=360,pos_bottom=60,item_width=15,item_height=80))
worldmap.render()
from pyecharts.charts import Map #导入地图模块
from pyecharts import options as opts
#datapair数据获取与代码1一致
worldmap=Map(init_opts=opts.InitOpts(width="800px",height="400px",bg_color='white'))
worldmap.add(" ",data_pair=datapairtwo,maptype="world",is_map_symbol_show=False)
#取消红点显示
worldmap.set_series_opts(label_opts=opts.LabelOpts(is_show=False))#取消国家名显示
worldmap.set_global_opts(title_opts=opts.TitleOpts(title=" "),legend_opts=opts.LegendOpts(is_show=False),#取消标题显示以及图例显示
                         visualmap_opts=opts.VisualMapOpts(min_=0,max_=20,orient="horizontal",type_ ="color",
                                                           range_color=['#FCFCFC','#5CACEE','#6495ED'],
                                                           pos_left=360,pos_bottom=60,item_width=15,item_height=80))
worldmap.render()
绘制地理坐标图Geo
直接上代码
# 导入输出图片工具
from pyecharts.charts import Geo
from pyecharts import options as opts
from pyecharts.globals import GeoType
from pyecharts.globals import ChartType, SymbolType
def get_geo_data(txtname):
    alldata=[]
    with open(txtname, 'r', encoding='UTF-8') as f:
        lines = f.readlines()# 会自动的将文件按照换行符进行处理将处理好的每一行组成一个列表返回
    for line in lines[1:]:  # 前1行是表头,去掉,这个按照实际情况
        latlon=[]
        line_info = line.strip().split()       #把一行中的字符分开成一个列表,删除掉空行空格
        latlon=[line_info[0],float(line_info[1]),float(line_info[2])]
        #将站点名,经纬度坐标合并成为一个列表
        alldata.append(latlon)
    return alldata#最终形成一个嵌套列表
#得到坐标数据列表
zuobiao=get_geo_data("D:\#集训第三个模型\pythoncode_document\latlon.txt")
special_spot=[7911, 7956, 7943, 7958, 7938, 8004, 8042, 8159, 8157, 8122, 8063, 7995, 8039, 8016, 7846, 7838, 7818, 7786, 7748, 7756, 7622, 7620, 7597, 7568, 7603, 7607, 7647, 7626, 7629, 7588, 7410, 7243, 7171, 7016, 6895, 6723]
#构建元组(先构建列表再构建元组)
jiantoulist=[]
lujinglist=[]
a_list=[]
datapair=[]
for i in special_spot:
    lujinglist.append(zuobiao[i][0])
    a_list=[zuobiao[i][0],20]
    a=tuple(a_list)
    datapair.append(a)
linshilist=[]
for i in range(0,len(lujinglist)-1):
    linshilist=[lujinglist[i],lujinglist[i+1]]
    b=tuple(linshilist)
    jiantoulist.append(b)
#构建元组列表成功
geo = Geo(init_opts=opts.InitOpts(width="600px",height="400px",bg_color="white"))
geo.add_schema(maptype="杭州",center=[120.2779620000,30.3148070000],itemstyle_opts=opts.ItemStyleOpts(color="white", border_color="#111"))
#center代表这幅图的中心点,itemstyle_opts用于设置地图样式,这里设置了颜色
for i in special_spot:
    geo.add_coordinate(name=zuobiao[i][0],longitude=zuobiao[i][2],latitude=zuobiao[i][1])
#添加新的坐标点,地理图geo与地图map的一个重要区别就是geo可以在地图上增设新的坐标点
geo.add('',datapair, type_=GeoType.EFFECT_SCATTER, symbol_size=1,color="blue")
geo.add(
        "geo",
        data_pair=jiantoulist,
        type_=ChartType.LINES,    #这个指的是线类型
        effect_opts=opts.EffectOpts(symbol=SymbolType.ARROW,symbol_size=5,color="yellow"),
        #设置线的样式
        linestyle_opts=opts.LineStyleOpts(curve=0.2),#设置线的曲率
        is_large=True,
        is_polyline=False, #用于设置地图上地点之间连线的样式设置,
    )
geo.set_series_opts(label_opts=opts.LabelOpts(is_show=True,font_size=10,position="top"))
geo.set_global_opts(title_opts=opts.TitleOpts(title="杭州"))
geo.render()
#make_snapshot(snapshot,geo.render(), "tupain.png")
我的txt数据经纬度格式:

输出图片:

可以看到由于添加的坐标点集中在杭州的某一个较小的区域,地图显示的整体却很大,那么如何把地图放大到清楚的看到哪一部分坐标点呢?
更换代码
geo.add_schema(maptype="杭州",center=[120.2779620000,30.3148070000],itemstyle_opts=opts.ItemStyleOpts(color="white", border_color="#111"))
更换为
geo.add_schema(maptype="杭州",center=[120.2779620000,30.3148070000],zoom=20,itemstyle_opts=opts.ItemStyleOpts(color="white", border_color="#111"))
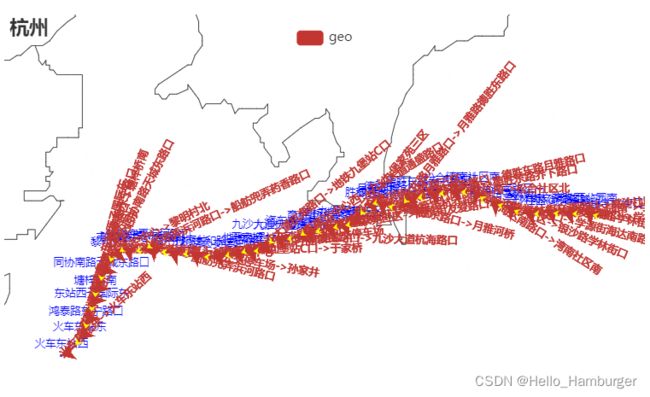
通过zoom的调节使得可以清晰看到标注点及所连线段,但是我们又发现了一个问题,图中标注应该是站点名称但是图中却显示了该站点的经纬度作为标注,那么如何标注为站点名呢?
更换代码
geo.set_series_opts(label_opts=opts.LabelOpts(is_show=True,font_size=10,position="top"))
更换为
geo.set_series_opts(label_opts=opts.LabelOpts(is_show=True,formatter='{b}',font_size=10,position="top"))
输出:

此时便可以显示出正确的地名,具体原因可以查阅手册formatter的用法。但是这时发现图中地名太大,以及红色箭头也很大,使得很不美观,如何解决呢?
1.使标签不显示即label处设置is_show=Flase
2.代码中is_polyline=False,修改为True
结果为:

最终完整代码:
from pyecharts.charts import Geo
from pyecharts import options as opts
from pyecharts.globals import GeoType
from pyecharts.globals import ChartType, SymbolType
#元组数据获取与前面的代码一致
geo = Geo(init_opts=opts.InitOpts(width="600px",height="400px",bg_color="white"))
geo.add_schema(maptype="杭州",center=[120.2779620000,30.3148070000],zoom=20,itemstyle_opts=opts.ItemStyleOpts(color="white", border_color="#111"),)
for i in special_spot:
    geo.add_coordinate(name=zuobiao[i][0],longitude=zuobiao[i][2],latitude=zuobiao[i][1])
geo.add('',datapair, type_=GeoType.EFFECT_SCATTER, symbol_size=1,color="blue")
geo.add(
        "geo",
        data_pair=jiantoulist,
        type_=ChartType.LINES,
        effect_opts=opts.EffectOpts(symbol=SymbolType.ARROW,symbol_size=5,color="yellow"),
        linestyle_opts=opts.LineStyleOpts(curve=0.2),
        is_large=True,
        is_polyline=True,
    )
geo.set_series_opts(label_opts=opts.LabelOpts(is_show=False,formatter='{b}',font_size=10,position="top"))
geo.set_global_opts(title_opts=opts.TitleOpts(title="杭州"))
geo.render()
总结
以上是我与大家分享的关于Map和Geo在使用时如何添加数据,如何对图形进行优化美化的分享,pyecharts还有非常多绘制功能,大家可以通过查阅手册进行学习。
你们可能需要的
1.各种颜色16进制码
2.Map中各个国家中英文对应表
3.关于formatter的回答
4.pyecharts如何输出为png格式


