金融风控实战—模型可解释之shap
import time
import matplotlib.pyplot as plt
from sklearn.model_selection import train_test_split
import xgboost
import pandas as pd
import numpy as np
#混淆矩阵计算
from sklearn import metrics
from sklearn.metrics import roc_curve, auc,roc_auc_score
from sklearn.metrics import precision_score
from sklearn.metrics import accuracy_score
from sklearn.metrics import recall_score
from sklearn.metrics import f1_score
readFileName="data_Q5_filter.xlsx"
#读取excel
data=pd.read_excel(readFileName)
X=data.loc[:,"installment":"emp_length"]
y=data["target"]
train_x, test_x, y_train, y_test=train_test_split(X,y,test_size=0.3,random_state=0)

model = xgboost.XGBClassifier(eval_metric=['logloss','auc','error'],use_label_encoder=False)
model.fit(train_x,y_train)
#XGBClassifier(base_score=0.5, booster='gbtree', colsample_bylevel=1,
#              colsample_bynode=1, colsample_bytree=1,
#              eval_metric=['logloss', 'auc', 'error'], gamma=0, gpu_id=-1,
#              importance_type='gain', interaction_constraints='',
#              learning_rate=0.300000012, max_delta_step=0, max_depth=6,
#              min_child_weight=1, missing=nan, monotone_constraints='()',
#              n_estimators=100,n_jobs=8,num_parallel_tree=1,random_state=0,
#              reg_alpha=0, reg_lambda=1, scale_pos_weight=1, subsample=1,
#              tree_method='exact', use_label_encoder=False,
#              validate_parameters=1, verbosity=None)
shap.plots.waterfall瀑布图-展示单个用户变量影响
shap.explainer:
This is the primary explainer interface for the SHAP library. It takes any combination of a model and masker and returns a callable subclass object that implements the particular estimation algorithm that was chosen.
这是 SHAP 库的主要解释器接口。它采用模型和掩码的任意组合,并返回一个可调用的子类对象,该对象实现所选的特定估计算法。
import shap
shap.initjs()  # notebook环境下,加载用于可视化的JS代码
explainer1 = shap.Explainer(model)
shap_values1 = explainer1(X)
shap_values1
#.values =
#array([[ 0.12214637,  0.5763162 ,  0.09239966, ...,  0.05956555,
#        -0.08578542,  0.00583912],
#       [-3.3557818 ,  1.981333  ,  0.589741  , ...,  0.00633732,
#        -0.07526105, -0.11162438],
#       [-0.33665466,  1.1700472 ,  0.24532834, ...,  0.04161756,
#        -0.02426036, -0.1627982 ],
#       ...,
#       [-2.7578328 , -0.5021786 , -0.2805183 , ..., -0.04732708,
#         0.02320154, -0.00695255],
#       [-0.68766063, -1.0604968 , -0.34821302, ...,  0.27330098,
#         0.30684933,  0.27966177],
#       [-1.0541837 , -0.6048023 ,  0.13503188, ..., -0.03302696,
#        -0.11473337, -0.08085796]], dtype=float32)
#
#.base_values =
#array([-4.852247, -4.852247, -4.852247, ..., -4.852247, -4.852247,
#       -4.852247], dtype=float32)
#
#.data =
#array([[3.24230e+02, 4.78340e+02, 3.24230e+02, ..., 1.58000e+02,
#        1.00000e+00, 0.00000e+00],
#       [8.49200e+01, 1.13980e+02, 8.49200e+01, ..., 1.40000e+02,
#        2.00000e+00, 1.00000e+01],
#       [2.76490e+02, 2.83370e+02, 2.76490e+02, ..., 4.00000e+00,
#        4.00000e+00, 0.00000e+00],
#       ...,
#       [1.69830e+02, 5.79600e+02, 1.69830e+02, ..., 1.47000e+02,
#        1.60000e+01, 1.00000e+01],
#       [3.27680e+02, 1.19947e+03, 3.27680e+02, ..., 6.10000e+01,
#        2.00000e+00, 1.10000e+01],
#       [3.56080e+02, 1.10657e+03, 3.56080e+02, ..., 1.44000e+02,
#        1.20000e+01, 2.00000e+00]])
shap_values1[0]
#.values =
#array([ 0.12214637,  0.5763162 ,  0.09239966,  0.6356046 , -0.922258  ,
#        0.17202896,  0.7647206 , -0.12842692, -0.24789801, -0.8769324 ,
#       -0.10680736, -0.07461585,  0.05956555, -0.08578542,  0.00583912],
#      dtype=float32)
#
#.base_values =
#-4.852247
#
#.data =
#array([3.2423e+02, 4.7834e+02, 3.2423e+02, 6.3985e+02, 1.0330e-01,
#       6.3985e+02, 1.6151e+02, 2.7500e+02, 6.1500e+00, 2.8000e+05,
#       1.7631e+04, 4.6000e+01, 1.5800e+02, 1.0000e+00, 0.0000e+00])
SHAP瀑布图
可视化第一个预测的解释:
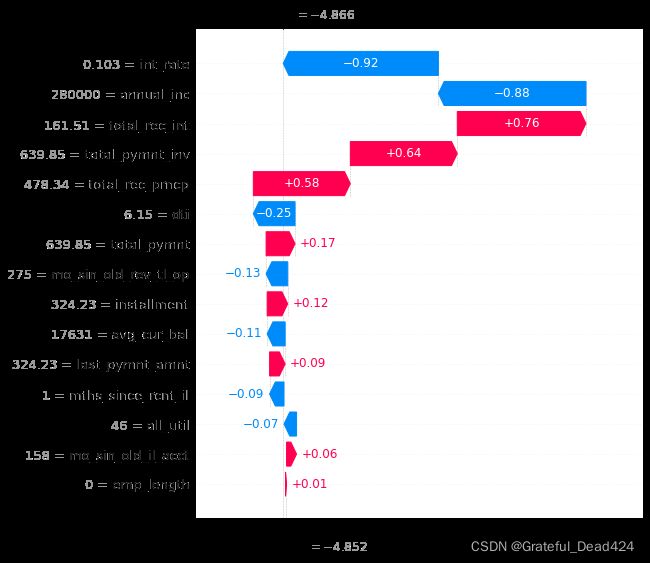
shap.plots.waterfall(shap_values1[0])
#max_display显示y轴展现变量数量,默认参数是10
shap.plots.waterfall(shap_values1[0],max_display=20)
shap公式
基本值(base_value) ,即E[f(x)]是我们传入数据集上模型预测值的均值,可以通过自己计算来验证:
现在我们知道每个特征对第一次预测的贡献。对上图的解释: X轴是log-odds对数值
y轴是各个变量的数值
蓝色条显示某一特定特征在多大程度上降低了预测的值。 红条显示了一个特定的特征在多大程度上增加了预测值。 例如当total_pymt=639.85时,大大增加坏客户概率;当int_rate=0.103时,大大减少坏客户概率
我们应该期望总贡献等于预测与均值预测的差值。我们来验证一下: f(x)-E(f(x))=-3.161+5.599=2.438
0.97+0.81+0.76+0.52-0.37-0.31+0.25-0.16+0.15-0.19=2.4299999999999997
0.97是total_pymt=639.85时的shap值,当shap值>0时,表示该特征提升了预测值,也正向作用;反之,说明该特征使得预测值降低,有反作用。
#第二条记录
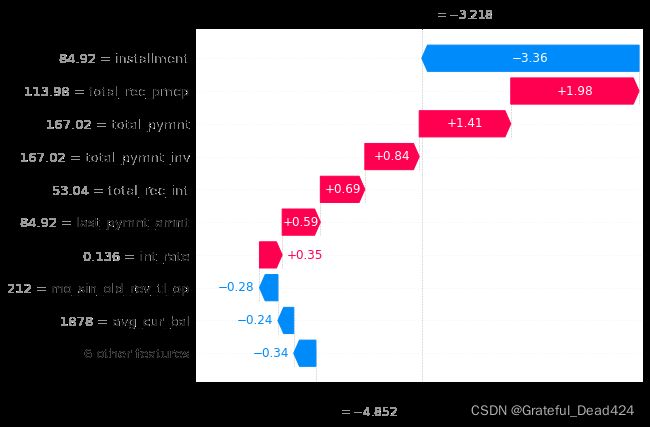
shap.plots.waterfall(shap_values1[1])
shap.plots.waterfall(shap_values1[3])

由于瀑布图只显示一个样本值的数据,我们无法看到变量的动态变化带来的影响
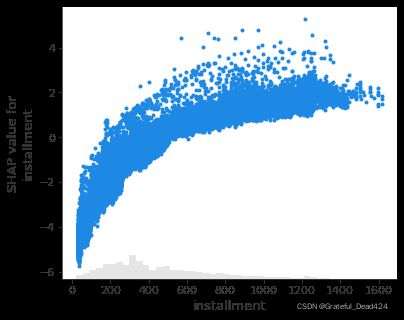
我们用散点图scatter来观察变量的动态变化
例如installment分期付款金额,整体趋势是这个值越大,shap value更高,坏客户概率越高
shap.plots.scatter(shap_values1[:,"installment"])
shap.TreeExplainer
Tree SHAP is a fast and exact method to estimate SHAP values for tree models and ensembles of trees, under several different possible assumptions about feature dependence. It depends on fast C++ implementations either inside an externel model package or in the local compiled C extention.Tree SHAP是一种快速而精确的方法,用于估计树模型和树集合的SHAP值,在关于特征依赖性的几种不同的可能假设下。它依赖于快速的C++实现,既可以在外部模型包内,也可以在本地编译的C扩展中实现。Tree SHAP 方法在数学上等效于对特征的所有可能排序的预测差异进行平均,而不仅仅是由它们在树中的位置指定的排序。只有 Tree SHAP 既一致又准确,这并非巧合。
explainer = shap.TreeExplainer(model)
# 最新版本的shap对于LGBMClassifier得到的shap_values为两个数组的列表,即两个分类的结果,这里使用分类1的结果
shap_values = explainer.shap_values(X)
shap_values
#array([[ 0.12214637,  0.5763162 ,  0.09239966, ...,  0.05956555,
#        -0.08578542,  0.00583912],
#       [-3.3557818 ,  1.981333  ,  0.589741  , ...,  0.00633732,
#        -0.07526105, -0.11162438],
#       [-0.33665466,  1.1700472 ,  0.24532834, ...,  0.04161756,
#        -0.02426036, -0.1627982 ],
#       ...,
#       [-2.7578328 , -0.5021786 , -0.2805183 , ..., -0.04732708,
#         0.02320154, -0.00695255],
#       [-0.68766063, -1.0604968 , -0.34821302, ...,  0.27330098,
#         0.30684933,  0.27966177],
#       [-1.0541837 , -0.6048023 ,  0.13503188, ..., -0.03302696,
#        -0.11473337, -0.08085796]], dtype=float32)
force plot是针对单个样本预测的解释,它可以将shap values可视化为force,每个特征值都是一个增加或减少预测的force,预测从基线开始,基线是解释模型的常数,每个归因值是一个箭头,增加(正值)或减少(负值)预测。
红色的为正贡献,蓝色为负贡献,对于第一个样本,由上图可以解释为特征total_pymnt=639.9的正贡献第一,total_pymnt_inv=639.9的正贡献第二,但是int_rate=0.1033的负贡献最大
# 可视化第一个prediction的解释   如果不想用JS,传入matplotlib=True
shap.force_plot(explainer.expected_value, shap_values[0,:], X.iloc[0,:])
explainer.expected_value
#-4.852247
shap.force_plot(explainer.expected_value, shap_values[1,:], X.iloc[1,:])

个图是直接由shap values绘成的,可以比较第一个样本的shap values具体数值:所以就算不绘制force plot,直接获取样本的shap values,就可以知道每个特征值是如何贡献得到模型预测值的。
sample_0_shap = pd.DataFrame(X.iloc[0,:])
sample_0_shap.rename(columns={0: 'feature_value'}, inplace=True)
sample_0_shap['shap_value'] = shap_values[0]
sample_0_shap.sort_values('shap_value', ascending=False)
shap.plots.bar
#绘图feature importance
shap.summary_plot(shap_values, X, plot_type="bar")
汇总:installment分期金额,total_rec_prncp迄今收到金额,int_rate贷款利率为前三最重要变量
其实如果要查看特征值大小与预测影响之间的关系的话,第二种图还是不够清楚,所以这里主要讲第一种图,第一种图其实就是对shap values按照特征维度聚合计算平均绝对值,也就是,使用该公式去计算shap values,可得到下表:
feature_importance = pd.DataFrame()
feature_importance['feature'] = X.columns
feature_importance['importance'] = np.abs(shap_values).mean(0)
feature_importance.sort_values('importance', ascending=False)
summary_plot
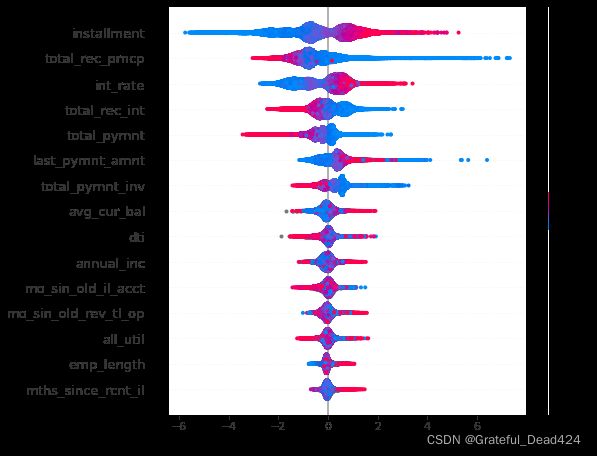
summary plot 为每个样本绘制其每个特征的SHAP值,这可以更好地理解整体模式,并允许发现预测异常值。每一行代表一个特征,横坐标为SHAP值。一个点代表一个样本,颜色表示特征值(红色高,蓝色低)。比如,这张图表明installment分期付款金额值越高,会降提升坏客户概率
shap.summary_plot(shap_values, X)
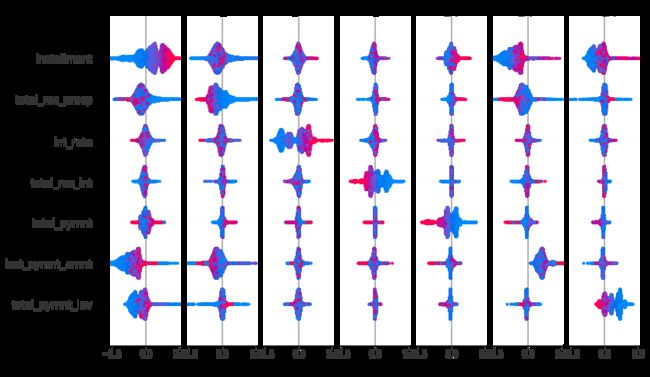
interaction value是将SHAP值推广到更高阶交互的一种方法。树模型实现了快速、精确的两两交互计算,这将为每个预测返回一个矩阵,其中主要影响在对角线上,交互影响在对角线外。这些数值往往揭示了有趣的隐藏关系(交互作用)
#当数据量大时,shap_interaction_values函数调用时非常耗时,建议关闭电脑其他应用,加速计算。
shap_interaction_values = explainer.shap_interaction_values(X)
shap.summary_plot(shap_interaction_values, X)
dependence_plot
如果要看特征值大小与预测影响之间的关系使用dependence plot更合适,dependence plot清楚地展示了单个特征是如何影响模型的预测结果的,dependence plot同样有多种使用方式,一种是查看某个特征是如何影响到模型预测结果的,另一种是一个特征是如何和另一个特征交互影响到模型预测结果的。
shap.dependence_plot('installment', shap_values, X, interaction_index=None)
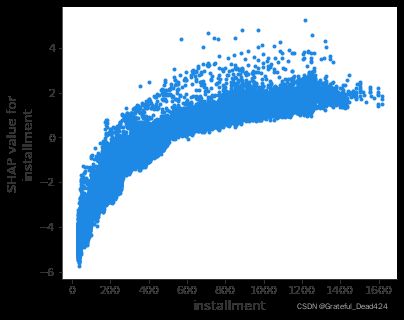
总结:installment分期金额越大,坏客户概率越高
此图和scatter散点图绘制效果一致
shap.dependence_plot('installment', shap_values, X, interaction_index='installment')
shap.dependence_plot('int_rate', shap_values, X, interaction_index=None)
shap.dependence_plot('installment', shap_values, X, interaction_index='int_rate')

汇总:installment分期金额越大,int_rate贷款利率越高,坏客户风险越大;但不绝对
shap.dependence_plot('installment', shap_values, X, interaction_index='total_rec_prncp')
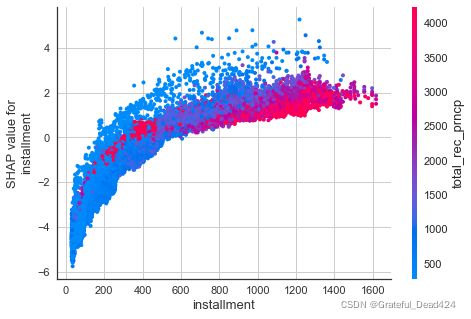
迄今收到的本金total_rec_prncp和installment分期金额交互明显
shap.dependence_plot('installment', shap_values, X, interaction_index='emp_length')

汇总:installment分期金额越大,emp_length对installment分期金额影响不明显,红色蓝色点几乎均匀混杂在一起

