泰坦尼克数据集预测分析
Imagine your group of friends have decided to spend the vacations by travelling to an amazing destination. And you have been given the responsibility to find one. Interesting? However interesting it may seem, choosing a single location for which everyone agrees is still a hectic task. There are various factors that need to be considered while choosing the location. The cost of the travel journey to the location should fit everyone's pockets. There should be proper accommodation options. The remoteness of the location, activities available, the best time to visit the locations and so on.
想象一下,您的一群朋友决定通过前往一个奇妙的目的地来度过假期。 并且您有责任找到一个。 有趣? 无论看起来多么有趣,选择每个人都同意的单一位置仍然是一项繁重的任务。 选择位置时,需要考虑多种因素。 前往该地点的旅行费用应适合每个人的腰包。 应该有适当的住宿选择。 位置的偏远性,可用的活动 , 访问位置的最佳时间等。
To get the information about all these factors you have to search on the internet and get information from various sources. After getting all these information, you then have to compare and find a right trade-off between the factors of these locations. The very same activity of gathering, understanding and comparing the data(can be in a visual representation) to help make better decisions is known as Exploratory Data Analysis.
要获取有关所有这些因素的信息,您必须在Internet上搜索并从各种来源获取信息。 在获得所有这些信息之后,您必须比较并在这些位置的因素之间找到正确的权衡。 收集 , 理解和比较数据(可以以视觉方式表示)以帮助做出更好的决策的相同活动被称为探索性数据分析 。
In this article we’ll be Exploring the data of the legendary — ‘Titanic’. We will be using ‘Titanic: Machine Learning from Disaster’ data-set on Kaggle to dive deep into it. The main objective, however, is to predict the survival of the passengers based on the attributes given, here, we’ll be exploring the data-set to find the Hidden Story which was covered along with Sinking of the Titanic. We’ll be unraveling some amazing mysteries behind the sinking of Titanic which you hardly might have heard of. So, get in your detective hat and magnifying glass, ‘coz we’ll be exploring History’s one of the most interesting data till date!
在本文中,我们将探索传说中的“泰坦尼克号”数据。 我们将使用Kaggle上的“ 泰坦尼克号:从灾难中学习机器 ”数据集来深入研究它。 但是,主要目的是根据给定的属性预测乘客的生存,在这里,我们将探索数据集,以查找《泰坦尼克号沉没》所涵盖的隐藏故事 。 在泰坦尼克号沉没的背后,我们将揭开一些令人难以置信的神秘面纱 ,您可能几乎没有听说过。 因此,戴上您的侦探帽和放大镜,因为到目前为止,我们将探索历史上最有趣的数据之一!
The basic requirements for this project will be a basic understanding about the Python language along with some basic plotting library of Matplotlib, Seaborn etc. If you don’t know any of these, it’s completely alright ‘coz at the end of this article you will be having a basic understanding about it. I’ll be recommending to use ‘Jupyter notebook’ or the simpler and the better option- ‘Google Colab’. Know how to setup your Google Colab by following the simple steps mentioned in this link — https://www.geeksforgeeks.org/how-to-use-google-colab/. After opening and setting up the Google Colab, it’s time to bring your inner Data Scientist out :)
该项目的基本要求将是对Python语言以及Matplotlib,Seaborn等基本绘图库的基本了解。如果您不了解其中任何一个,那么在本文结尾处完全可以使用'coz',对它有基本的了解。 我建议使用“ Jupyter笔记本”或更简单,更好的选择-“ Google Colab”。 遵循此链接中提到的简单步骤,了解如何设置Google Colab — https://www.geeksforgeeks.org/how-to-use-google-colab/ 。 打开并设置Google Colab之后,是时候将您的内部数据科学家带出来了:)
I have also provided the link to the Google Colab Notebook having all these code.
我还提供了包含所有这些代码的Google Colab Notebook的链接。
To import the data from Kaggle into Google Colab follow these steps—
要将数据从Kaggle导入Google Colab,请按照以下步骤操作:
- Go to your account, Click on Create New API Token — It will download kaggle.json file on your machine. 转到您的帐户,单击“创建新的API令牌”,它将在您的计算机上下载kaggle.json文件。
- Go to your Google Colab project file and run the following commands: 转到您的Google Colab项目文件,然后运行以下命令:
选择您已下载的kaggle.json文件 (Choose the kaggle.json file that you have downloaded)
创建名为kaggle的目录,并将kaggle.json文件复制到其中。 (Make directory named kaggle and copy kaggle.json file into it.)
更改文件的权限并下载数据集 (Change the permissions of the file and download the data-set)
Make sure the Drive is Mounted and appropriate folders are created . Here in my case folders Projects>datasets were created where we’ll be moving the downloaded data-set to avoid importing from kaggle repeatedly.
确保已安装驱动器并创建了适当的文件夹。 在我的案例中,这里创建了Projects> datasets文件夹,我们将在其中移动下载的数据集,以避免重复从kaggle导入。
Congratulations, you’ve successfully imported the data-set from Kaggle and stored it into your Google Drive. Next time whenever we need the data-set we can do so by simply copying the path of the file and loading it.
恭喜,您已成功从Kaggle导入数据集并将其存储到Google云端硬盘中。 下次,只要我们需要数据集,我们都可以通过简单地复制文件的路径并加载它来实现。
Now, let’s start by importing the required libraries
现在,让我们开始导入所需的库
Before jumping into EDA let’s first load the data-set and have quick glance on it. Below are the libraries that we may require.
在进入EDA之前,我们首先加载数据集并快速浏览一下。 以下是我们可能需要的库。
The data can be loaded in the format of Pandas’ Dataframe as follows and ‘data.shape’ print the dimensions of the data where 891 represents the number of records and 12 represents the number of attributes. Now the path to ‘train.csv’ may vary as per your file’s location. You may directly copy and paste the path to the file in ‘Files’ section right below the ‘Table of Contents’ section (As on year 2020).
数据可以如下所示以Pandas的Dataframe格式加载,“ data.shape”打印数据的尺寸,其中891代表记录数,12代表属性数。 现在,根据您文件的位置,“ train.csv”的路径可能会有所不同。 您可以直接将路径复制并粘贴到“目录”部分下方的“文件”部分中(截至2020年)。
Output:
输出:
Viewing an entire data-set at once can be confusing. So, let’s view some sample of the data. ‘data.head()’ gives the ‘starting 5’ and ‘data.tail()’ gives the bottom 5 records/rows of the dataframe based on the index of the row.
一次查看整个数据集可能会造成混淆。 因此,让我们查看一些数据样本。 “ data.head()”给出“起始5”,而“ data.tail()”给出基于行的索引的数据帧的底部5条记录/行。
Output:
输出:
data.head() data.head() data.tail() data.tail()Now, let’s print the columns of the dataframe.
现在,让我们打印数据框的列。
Output:
输出:
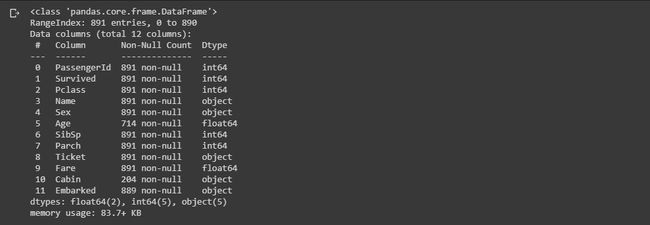
‘data.info()’ gives information about each attribute and the count of non-null/ non-missing values in each attribute and its datatype. As you can see in the output, the attributes, ‘Age’, ‘Cabin’ and ‘Embarked’ have some missing values present in them.(The processing of these missing values will be done in later modules.)
“ data.info()”提供有关每个属性以及每个属性及其数据类型中非空/非缺失值的计数的信息。 从输出中可以看到,属性'Age','Cabin'和'Embarked'中存在一些缺失值(这些缺失值的处理将在以后的模块中完成)。
Output:
输出:
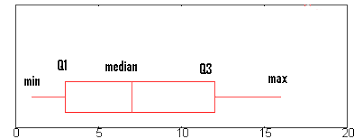
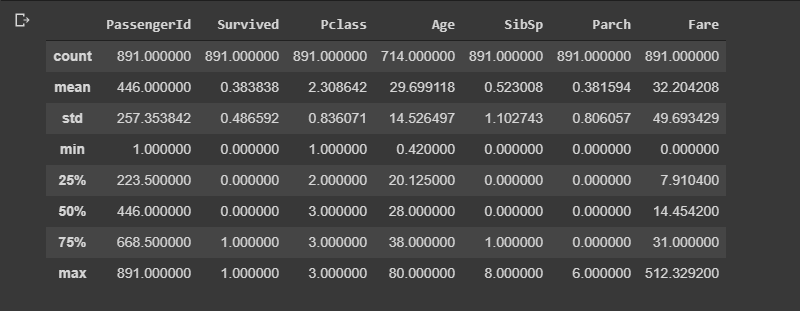
If you have numerical data in the data-set, ‘data.describe()’ can be used to get count, standard deviation, mean and five number summary i.e minimum, 25%(Q1), 50%(median), 75%(Q3) and maximum of each attribute.
如果数据集中有数字数据,则可以使用“ data.describe()”来获取计数,标准偏差,均值和五个数字摘要,即最小值,25%(Q1),50%(中位数),75% (Q3)和每个属性的最大值。
www.statisticshowto.com www.statisticshowto.comOutput:
输出:
了解数据 (Understanding the data)
Okay, so we’ve seen the samples of the data. But what does each of the attributes denote. The description of the attributes are provided in the Kaggle itself. But I’ll try to explain it here to get a better gist of it.
好的,我们已经看到了数据样本。 但是每个属性代表什么。 属性的说明在Kaggle本身中提供。 但是,我将在这里尝试解释它,以便更好地理解它。
There are a total of 891 instances, each consisting of 12 attributes. So here’s a brief information about what the data consist of-
共有891个实例,每个实例包含12个属性。 因此,这是有关数据组成的简要信息-
Passenger Id: A unique id given for each passenger in the data-set.
乘客ID :为数据集中的每个乘客提供的唯一ID。
2. Survived: It denotes whether the passenger survived or not.
2.幸存 :表示乘客是否幸存。
Here,
这里,
- 0 = Not Survived 0 =未幸存
- 1 = Survived 1 =幸存
3. Pclass: Pclass represents the Ticket class which is also considered as proxy for socio-economic status (SES)
3. Pclass :Pclass代表票证类,也被视为社会经济地位(SES)的代理
Here,
这里,
- 1 = Upper Class 1 =上层阶级
- 2 = Middle Class 2 =中产阶级
- 3 = Lower Class 3 =下层阶级
4. Name: Name of the Passenger
4.姓名 :旅客姓名
5. Sex: Denotes the Sex/Gender of the passenger i.e ‘male’ or ‘female’.
5.性别 :表示乘客的性别/性别,即“男性”或“女性”。
6. Age: Denotes the age of the passenger
6.年龄 :表示乘客的年龄
Note: If the passenger’s a baby then it’s age is represented in fraction. e.g. 0.33. If the age is estimated, is it in the form of xx.5. e.g. 18.5
注意:如果乘客是婴儿,则年龄以分数表示。 例如0.33。 如果估计年龄,则采用xx.5的形式。 例如18.5
7. SibSp: It represents no. of siblings / spouses aboard the Titanic
7. SibSp :它代表否。 泰坦尼克号上的兄弟姐妹/配偶
The data-set defines family relations in this way…
数据集以这种方式定义了家庭关系…
- Sibling = brother, sister, stepbrother, stepsister 兄弟姐妹=兄弟,姐妹,继兄弟,继父
- Spouse = husband, wife (mistresses and fiances were ignored) 配偶=丈夫,妻子(情妇和未婚夫被忽略)
8. Parch: It represents no. of parents / children aboard the Titanic
8. Parch :代表否。 泰坦尼克号上的父母/子女总数
The dataset defines family relations in this way…
数据集以这种方式定义家庭关系…
- Parent = mother, father 父母=母亲,父亲
- Child = daughter, son, stepdaughter, stepson 孩子=女儿,儿子,继女,继子
- Some children travelled only with a nanny, therefore parch=0 for them. 一些孩子只带一个保姆旅行,因此他们的parch = 0。
9. Ticket: It represents the ticket number of the passenger
9.机票 :代表乘客的机票号码
10. Fare: It represents Passenger fare.
10.票价 :代表旅客票价。
11. Cabin: It represents the Cabin No.
11.机舱 :代表机舱号。
12. Embarked: It represents the Port of Embarkation
12.登船 :代表登船港
Here,
这里,
- C = Cherbourg C =瑟堡
- Q = Queenstown Q =皇后镇
- S = Southampton S =南安普敦
Okay, so now that we have understood the data, let’s hop on to understand the relation between each of the attributes and understand what factors played a major role in the Survival of a Passenger and to also predict if you were in the Titanic, would you have survived or not? Click on the Link to the next story to find out!
好的,现在我们已经了解了数据,让我们开始了解每个属性之间的关系,并了解哪些因素在旅客的生存中起着重要作用,并预测您是否在泰坦尼克号上,幸存了没有? 单击链接到下一个故事以查找!
Link to the Notebook: Click Here
链接到笔记本: 单击此处
Link to Part 2 of the Blog: Click Here
链接到博客的第2部分: 单击此处
翻译自: https://medium.com/@bapreetam/exploratory-data-analysis-a-case-study-on-titanic-data-set-part-1-d1376b2a6cef
泰坦尼克数据集预测分析


