多因素deseq2 formula 怎么理解 如何设置design 哈佛大学——差异表达分析(七)设计公式(Design formulas)多因素差异分析 多个影响因子会影响差异分析结果 多因子
Count normalization with DESeq2 | Introduction to DGE
精华步骤代码说明
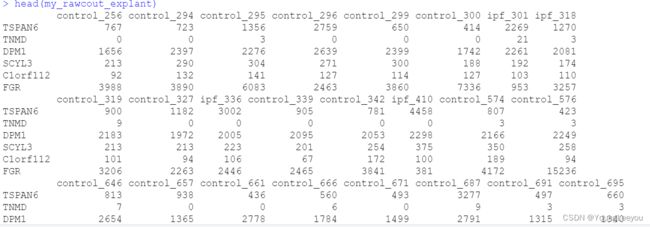
1.my_rawcout_explant 为表达矩阵 行名为基因 列名为样本 ,矩阵必须是raw data 不可以是normalized之后的矩阵
2.my_coldata_explant 为dataframe,是样本的meta信息,行名为样本名,列名为样本的各种meta信息比如 年龄 性别 种族 取样方法等,且my_coldata_explant 的列名顺序必须与表达矩阵的列名顺序一致
3.~Sex+age+race+plate+institution + diagnosis 代表design formula ,表示如何进行差异分析在公式中输入的最后一个因子应该是感兴趣的条件。
dds <- DESeqDataSetFromMatrix(countData = my_rawcout_explant,#生成deseq对象结构
                              colData = my_coldata_explant,
                              design= ~Sex+age+race+plate+institution + diagnosis)
dds <- DESeq(dds)

# or to shrink log fold changes association with condition:
res <- lfcShrink(dds, coef="condition_trt_vs_untrt", type="apeglm")

res=as_tibble(res)
res=res %>% filter(abs(log2FoldChange)>1 & pvalue<0.05 )
length(rownames(res)) #1962
openxlsx::write.xlsx(res,file ="G:/r/duqiang_IPF/GSE150910_IPF_Donors_subsets/degs_for_ipf vs control_filtered.xlsx" )
哈佛大学——差异表达分析(七)设计公式(Design formulas)_零级伪码农的博客-CSDN博客
DESeq2 model matrix formula - SEQanswers
DESeq2 design formula
利用DESeq2进行差异表达分析
运行DESeq2
设计公式(design formula)
差异表达分析工作流程的最后一步是将原始计数拟合到NB(负二项分布)模型中,并对差异表达基因进行统计检验。在这一步中,我们主要想确定不同样本组的平均表达水平是否有显著差异。
DESeq2论文发表于2014年,但该包不断更新,可通过Bioconductor在R中使用。它建立于从DSS和edgeR方法而来的散度估计和使用广义线性模型(Generalized Linear Models)这样的好想法之上。
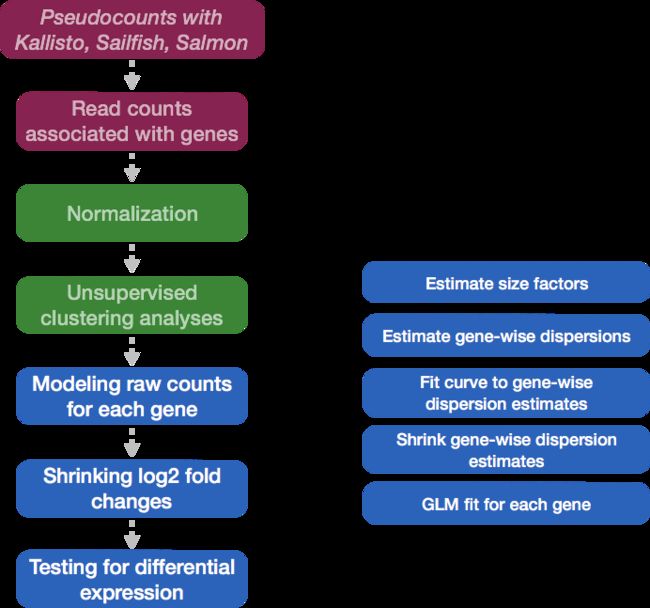
使用DESeq2进行差异表达分析涉及多个步骤,如下面的蓝色流程图所示。简单地说,DESeq2将对原始计数建模,使用归一化因子(大小因子)来解释文库深度的差异。然后,它将估计基因方面的分散(gene-wise dispersions),并缩小这些估计,以产生更准确的离散估计,以建立计数模型。最后,DESeq2拟合负二项模型,并使用Wald检验(Wald test)或似然比检验(Likelihood Ratio Test)进行假设检验。
注意:DESeq2由开发人员积极维护并不断更新。因此,注意使用的版本是很重要的。最近,实施了一些相当大的变化,影响了产出。对于2014年原始论文中所描述的方法所做的具体修改,可以查看DESeq2 vignette中的这一部分。
运行DESeq2
在执行差异表达分析之前,通过在QC期间的探索和/或之前的知识,了解数据中存在的变异来源是一个好主意。一旦知道了变异的主要来源,就可以在分析前删除它们,或通过在你统计模型的设计公式中包含他们来控制。
设计公式(design formula)
设计公式告诉统计软件已知可控制的变异源,以及在差异表达分析期间感兴趣的测试因素。例如,如果你知道性别是数据变异的重要来源,那么性别应该包含在你的模型中。设计公式应该包含metadata中的所有因素,这些因素可以解释数据中主要的变异来源。在公式中输入的最后一个因子应该是感兴趣的条件。
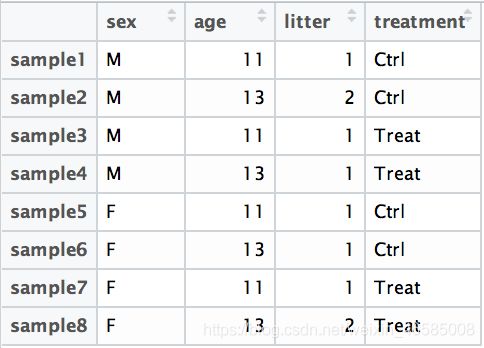
例如,假设你有以下metadata:
如果你想检验不同处理之间的表达差异,并且你知道变异的主要来源包括sex和age,那么你的设计公式将是:
design <- ~ sex + age + treatment
波浪号(~)应该总是在各种因素之前,并告诉DESeq2使用下面的公式来建模计数。注意,设计公式中包含的因素需要与metadata中的列名匹配。
Exercises
Suppose you wanted to study the expression differences between the two age groups in the metadata shown above, and major sources of variation were sex and treatment, how would the design formula be written?
Based on our Mov10 metadata dataframe, which factors could we include in our design formula?
What would you do if you wanted to include a factor in your design formula that is not in your metadata?
复杂的设计
DESeq2也允许分析复杂的设计。你可以通过在设计公式中指定来探索交互作用或“差异中的差异”。例如,如果你想探究性别对治疗效果的影响,你可以在设计公式中明确如下:
design <- ~ sex + age + treatment + sex:treatment
由于交互项sex:treatment在公式中最后,DESeq2输出针对该术语的结果。
在DESeq2 vignette中有关于复杂设计的额外建议。此外,Limma文档提供了创建更复杂设计公式的额外见解。
注意:需要帮助确定metadata中应该包含哪些信息? 我们有额外的材料强调了大量RNA-seq计划的考虑。请在开始实验前查看这些材料,以帮助正确的实验设计。
MOV10 差异表达分析
现在我们知道了如何将模型指定为DESeq2,我们可以在原始计数(raw counts) 上运行差异表达分析流程(pipeline)。
要从原始计数数据中获得DE结果,我们只需要运行两行代码!
首先,我们创建一个DESeqDataSet,就像我们在“计数归一化”课程中做的那样,并指定包含原始计数、metadata变量的txi对象,并提供我们的设计公式:
## Create DESeq2Dataset object
dds <- DESeqDataSetFromTximport(txi,
                                colData = meta,
                                 design = ~ sampletype)
然后,要运行实际的差异表达分析,我们使用对函数DESeq()的单个调用。
## Run analysis
dds <- DESeq(dds)
通过将函数的结果重新分配回相同的变量名(dds),我们可以填充DESeqDataSet对象的slots。
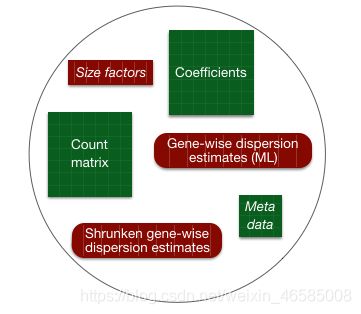
从归一化到线性建模的一切都是通过使用一个单一的函数来实现的!这个函数将打印出它执行的各个步骤的消息:
> dds <- DESeq(dds)
using pre-existing size factors
estimating dispersions
gene-wise dispersion estimates
mean-dispersion relationship
final dispersion estimates
fitting model and testing
我们将在下一课中讨论这些步骤中发生了什么,但是执行这些步骤的代码包含在上面的两行代码中。
注意:DESeq2中有一些单独的功能,可以让我们以一种循序渐进的方式执行工作流中的每一步,而不是单个调用。我们之前演示了一个生成大小因子以创建标准化矩阵的示例。通过调用DESeq(),将为您运行每个步骤的各个函数。
dds <- DESeqDataSetFromTximport(txi, colData = meta, design = ~ sampletype)

View(counts(dds))

dds <- estimateSizeFactors(dds)
sizeFactors(dds)
normalized_counts <- counts(dds, normalized = TRUE)

write.table(normalized_counts, file = 'data/normalized_counts.txt', sep = '\t', quote = FALSE, col.names = NA)
Exercise
Let’s suppose our experiment has the following metadata:
genotype treatment
sample1 WT ev
sample2 WT ev
sample3 WT ev
sample4 WT ev
sample5 KO_geneA ev
sample6 KO_geneA ev
sample7 KO_geneA ev
sample8 KO_geneA ev
sample9 WT treated
sample10 WT treated
sample11 WT treated
sample12 WT treated
sample13 KO_geneA treated
sample14 KO_geneA treated
sample15 KO_geneA treated
sample16 KO_geneA treated
How would the design formula be structured to perform the following analyses?
Test for the effect of treatment.
Test for the effect of genotype, while regressing out the variation due to treatment.
Test for the effect of genotype on the treatment effects. ***
Answers
# 1. Test for the effect of treatment.
# Ans: design <- ~ treatment

# 2. Test for the effect of genotype, while regressing out the variation due to treatment.
# Ans: design <- ~ treatment + genotype

# 3. Test for the effect of genotype on the treatment effects.
# Ans: design <- ~ genotype + treatment + genotype:treatment
