线性回归及正则化总结,python实现,非sklearn
0 引言
1 线性回归
在统计学中,线性回归(Linear Regression)是利用称为线性回归方程的最小平方函数对一个或多个自变量和因变量之间关系进行建模的一种回归分析。这种函数是一个或多个称为回归系数的模型参数的线性组合。只有一个自变量的情况称为简单回归,大于一个自变量情况的叫做多元回归。[1]
线性回归问题质还是一个最优化问题:最小化代价函数值。

线性回归有最小二乘法和梯度下降算法两种基本方法求解,最小二乘法能够求得最优解但是不容易推广,有着严格的数学限制,不如梯度下降算法的普适性强。
2 正则化
正则化的作用:避免学习过程中模型过拟合
常用的有L1、L2(岭回归)和ElasticNet正则化
| 正则化 | 效果 |
|---|---|
| L1 | 解具有稀疏性 |
| L2(岭回归) | 平衡解的光滑性,目标函数变为强凸性,解的性质更好 |
| ElasticNet | L1+L2,使解兼具稀疏性和光滑性 |
3 python实现
基于pytorch自动求导机制,使用梯度下降法求解线性回归问题。自动化程序拥有早停机制和正则化机制,包括L1、L2、ElasticNet三种正则化。
import numpy as np
import torch

def linere(x, epoch, eva, learning_rate, early_stopping, Regularization=None):
    itermax = epoch
    early_stopping = early_stopping
    eva = eva
    learning_rate = learning_rate
    Regularization = Regularization

    dtype = torch.float
    device = "cuda:0" if torch.cuda.is_available() else "cpu"
    a = torch.randn((), dtype=dtype, device=device, requires_grad=True)  # 斜率
    b = torch.randn((), dtype=dtype, device=device, requires_grad=True)  # 纵截距
    x = torch.from_numpy(x).to(device)  # GPU加速

    Loss = []  # 记录loss值
    for i in range(itermax):
        if Regularization == 'L1':
            lambda1 = 0.01
            R_loss = lambda1 * (abs(a) + abs(b))
        elif Regularization == 'L2':
            lambda2 = 0.01
            R_loss = lambda2 * (a.pow(2) + b.pow(2))
        elif Regularization == 'ElasticNet':
            lambda1 = 0.01
            lambda2 = 0.01
            R_loss = lambda1 * (abs(a) + abs(b)) + lambda2 * (a.pow(2) + b.pow(2))
        else:
            R_loss = 0
        y_pred = a * x[0, :] + b
        mse_loss = (1 / x.shape[1]) * (x[1, :] - y_pred).pow(2).sum() + R_loss  # 均方误差为损失函数
        Loss.append(mse_loss.item())
        if i % eva == 0:
            print(f"{i}:loss:{mse_loss.item()}")

        mse_loss.backward()  # 反向传播,这里没有使用批量GD,batch_size = x.shape[1]
        with torch.no_grad():
            a -= learning_rate * a.grad
            b -= learning_rate * b.grad

            a.grad = None  # 一次迭代更新后
            b.grad = None  # 梯度清零
        if early_stopping and i > 4:
            if abs(Loss[-4] - Loss[-3]) + abs(Loss[-3] - Loss[-2]) < 1e-5 or Loss[-1] > Loss[-2]:
                break
    return Loss, a, b
4 效果分析
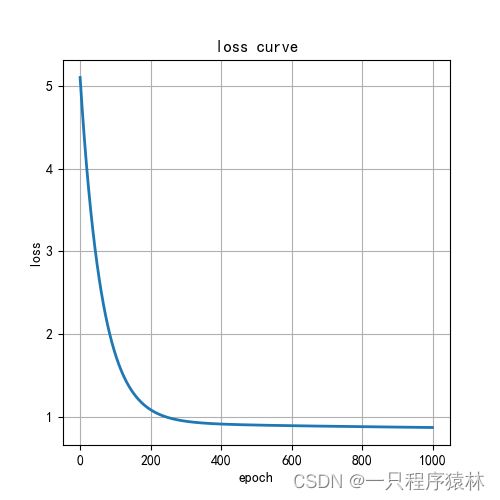
可视化代码如下:
使用L1正则化完成线性回归。
import matplotlib.pyplot as plt
import matplotlib as mpl

mpl.rcParams['font.sans-serif'] = [u'SimHei']
mpl.rcParams['axes.unicode_minus'] = False
if __name__ == "__main__":
    x = np.array([[0.5, 1.2, 0.9, 0.8, 2.1, 3.2, 2.2], [0.3, 1.4, 1.0, 1.9, 0.5, 4.6, 2.9]])
    loss, a, b = linere(x, early_stopping=True, learning_rate=1e-3, epoch=1000, eva=1,Regularization='L2')
    plt.figure(1, figsize=(5, 5))
    plt.plot(loss, linewidth=2)
    plt.title("loss curve")
    plt.xlabel("epoch")
    plt.ylabel("loss")
    plt.grid(True)
    plt.show()
    plt.figure(2, figsize=(5, 5))
    plt.scatter(x[0, :], x[1, :], color='b', linewidths=2)
    a = a.cpu().data.numpy()
    b = b.cpu().data.numpy()
    cx = np.linspace(0, 5, 1000)
    cy = a * cx + b
    plt.plot(cx, cy, color='r', linewidth=2, label=f"y = {b}+{a}x")
    plt.legend(loc='best')
    plt.grid(True)
    plt.show()
5 参考文献
[1]https://baike.baidu.com/item/%E7%BA%BF%E6%80%A7%E5%9B%9E%E5%BD%92/8190345?fr=aladdin#ref_[1]_449540

