【seaborn】3、Distribution plots 分布图
目录
-
- displot 直方图
- kdeplot 核密度图
- jointplot 联合分布图
- pairplot 变量关系组图
单变量的分布特征通过直方图就可以观察,而两个变量间的关系分布,用散点图更容易体现。
下面我们就介绍几种方法,简便的同时查看单变量分布和两个变量间相关性的分布
displot 直方图
老版本用的是 distplot, 现在用还不会报错,只是提示说 distplot 之后就要被遗弃了,建议用 displot
seaborn.displot(a, bins=None, hist=True, kde=True, rug=False, fit=None,
hist_kws=None, kde_kws=None, rug_kws=None, fit_kws=None, color=None,
 vertical=False, norm_hist=False, axlabel=None, label=None, ax=None)
- bins:int或list,控制直方图的划分,设置矩形图(就是块儿的多少)数量,除特殊要求一般默认;
- hist:是否显示方块;
- kde:是否显示核密度估计曲线;
- rug:控制是否生成观测数值的小细条(边际毛毯);
- fit:控制拟合的参数分布图形,能够直观地评估它与观察数据的对应关系(黑色线条为确定的分布);
- -{hist, kde, rug, fit}_kws :参数接收字典类型,可以自行定义更多高级的样式;
- norm_hist:若为True, 则直方图高度显示密度而非计数(含有kde图像中默认为True);
- vertical:放置的方向,如果为真,则观测值位于y-轴上(默认False,x轴上);
- axlabel : string, False, or None, 设置标签。
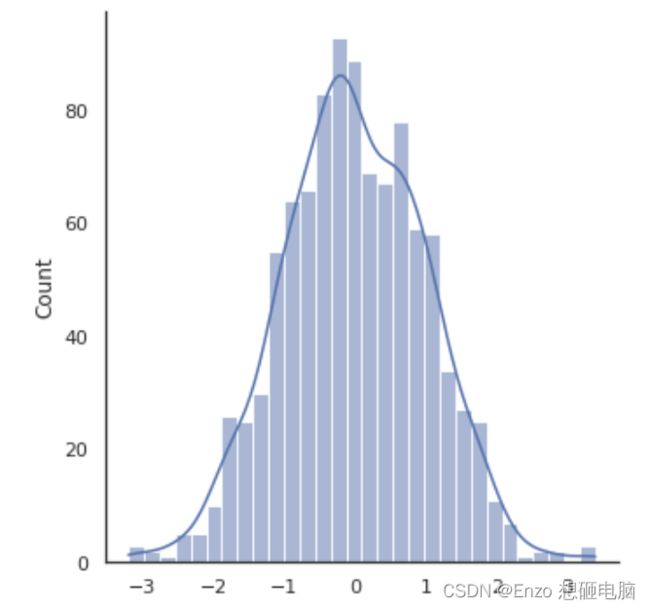
np.random.seed(666)
x = np.random.randn(1000)
sns.displot(x, kde=True, bins=30)
kdeplot 核密度图
seaborn.kdeplot(data, data2=None, shade=False, vertical=False, kernel='gau',
bw='scott', gridsize=100, cut=3, clip=None, legend=True, cumulative=False,
shade_lowest=True, cbar=False, cbar_ax=None, cbar_kws=None, ax=None, **kwargs)
- data、data2:表示可以输入双变量,绘制双变量核密度图;
- shade:是否填充阴影,默认不填充;
- vertical:放置的方向,如果为真,则观测值位于y轴上(默认False,x轴上);
- kernel:{‘gau’ | ‘cos’ | ‘biw’ | ‘epa’ | ‘tri’ | ‘triw’ }。默认高斯核(‘gau’)二元KDE只能使用高斯核。至于什么是核函数,这个学问就大了,建议多看看论文;
- bw:{‘scott’ | ‘silverman’ | scalar | pair of scalars }。四类核密度带方法,默认scott (斯考特带宽法),建议下来了解一下这四种方法的区别;
- gridsize:这个参数指的是每个格网里面,应该包含多少个点,越大,表示格网里面的点越多(觉得电脑OK的可以试试,有惊喜),越小表示格网里面的点越少;
- cut:参数表示,绘制的时候,切除带宽往数轴极限数值的多少,这个参数可以配合bw参数使用;
- cumulative:是否绘制累积分布;
- shade_lowest:是否有最低值渲染,这个参数只有在二维密度图上才有效;
- clip:表示查看部分结果,是一个区间;
- cbar:参数若为True,则会添加一个颜色棒(颜色帮在二元kde图像中才有);
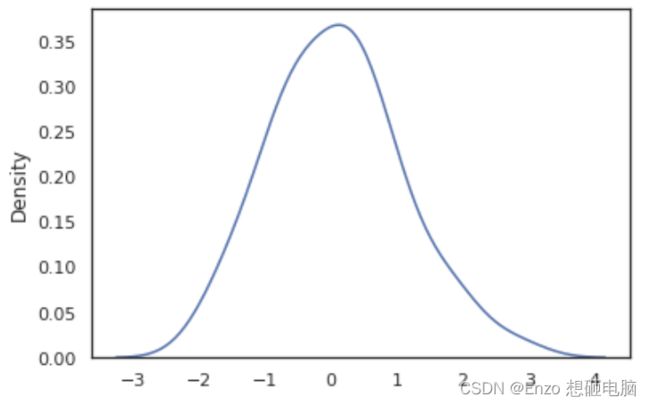
mean, cov = [0, 2], [(1, .5), (.5, 1)]
#这是一个多元正态分布
x, y = np.random.multivariate_normal(mean, cov, size=50).T
sns.kdeplot(x)
绘制双变量核密度图 (1)
sns.kdeplot(x,y,shade=True,shade_lowest=False,cbar=True,color='r')
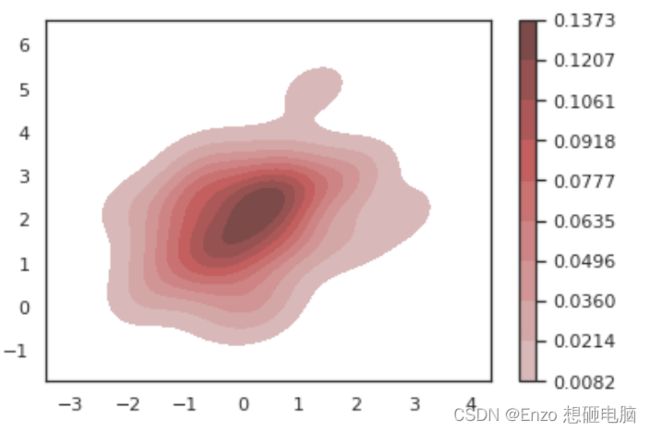
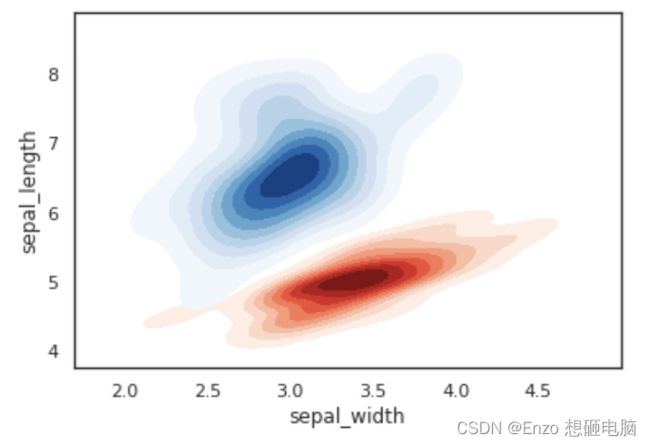
绘制双变量核密度图 (2):二色二元密度图,使用大名鼎鼎的鸢尾花数据集
setosa = iris.loc[iris.species == "setosa"]
virginica = iris.loc[iris.species == "virginica"]

sns.kdeplot(setosa.sepal_width, setosa.sepal_length,cmap="Reds",
            shade=True, shade_lowest=False)

sns.kdeplot(virginica.sepal_width, virginica.sepal_length,cmap="Blues",
            shade=True, shade_lowest=False)
jointplot 联合分布图
seaborn.jointplot(x, y, data=None, kind='scatter', stat_func=None, color=None,
height=6, ratio=5, space=0.2, dropna=True, xlim=None, ylim=None, joint_kws=None,
 marginal_kws=None, annot_kws=None, **kwargs)
- x,y:为DataFrame中的列名或者是两组数据,data指向dataframe;
- kind : { “scatter” | “reg” | “resid” | “kde” | “hex” }。默认散点图;
- stat_func:用于计算统计量关系的函数;
- ratio:中心图与侧边图的比例,越大、中心图占比越大;
- dropna:去除缺失值;
- height:图的尺度大小(正方形);
- space:中心图与侧边图的间隔大小;
- xlim,ylim:x,y的范围
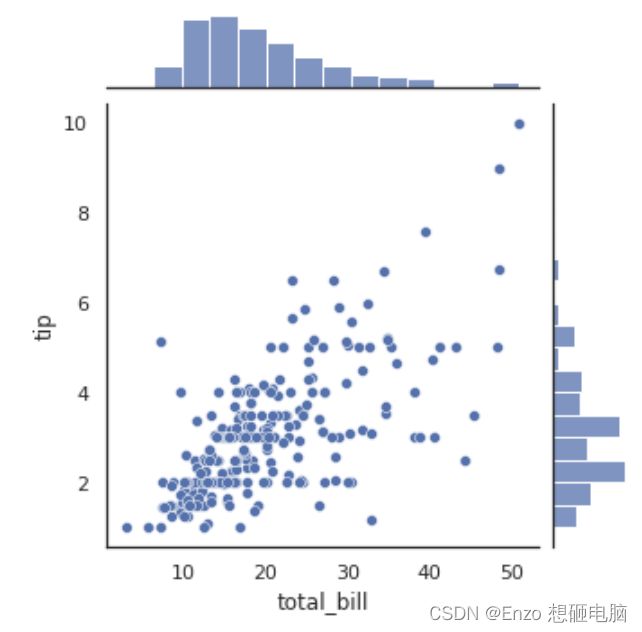
sns.jointplot(x="total_bill", y="tip", data=tips,height=5)
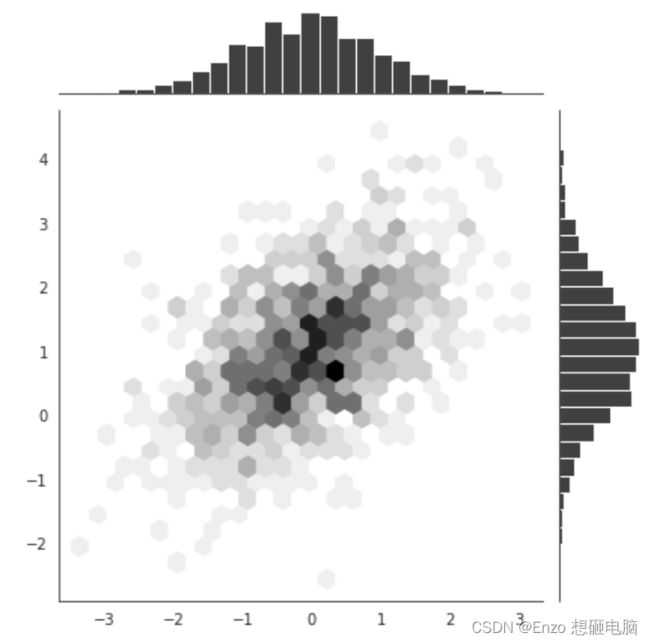
3、当数据量比较大时,散点图的点容易堆叠在一起,不易分辨,我们可以指定参数 kind 为 ‘hex’ , 用颜色深度来表示数据的密度
import numpy as np
import pandas as pd
import seaborn as sns
import matplotlib.pyplot as plt

mean, cov = [0, 1], [(1, 0.5), (0.5, 1)]
x, y = np.random.multivariate_normal(mean, cov, 1000).T
with sns.axes_style('white'):
    sns.jointplot(x=x, y=y, kind='hex', color='k')
pairplot 变量关系组图
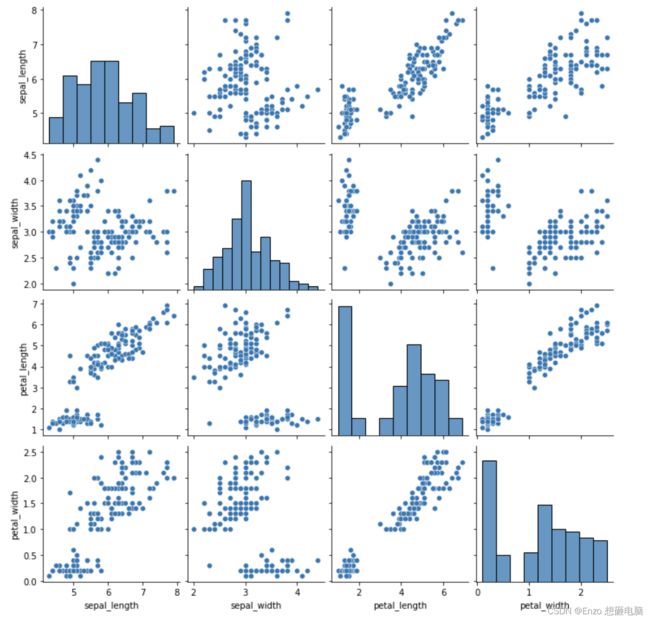
多变量数据,查看两两之间的关系
seaborn.pairplot(data, hue=None, hue_order=None, palette=None, vars=None,
x_vars=None, y_vars=None, kind='scatter', diag_kind='auto', markers=None,
 height=2.5, aspect=1, dropna=True, plot_kws=None, diag_kws=None,
 grid_kws=None, size=None)
- var:data中的子集,否则使用data中的每一列;
- x_vars / y_vars:可以具体细分,谁与谁比较;
- kind:{‘scatter’, ‘reg’};
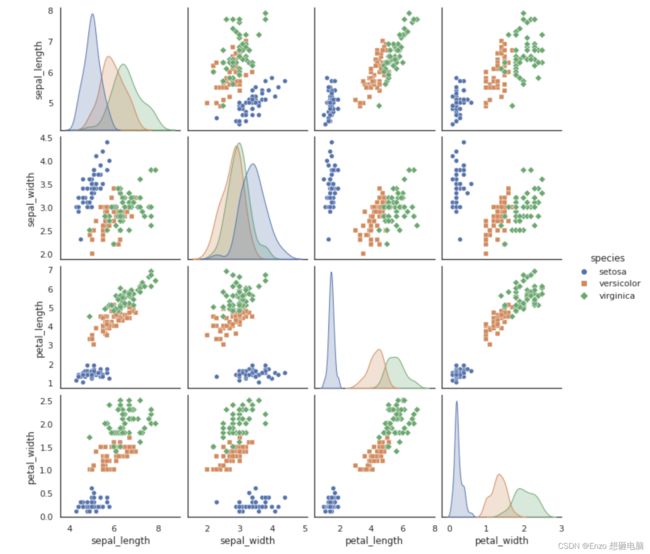
- diag_kind:{‘auto’, ‘hist’, ‘kde’}。单变量图(自己与自己比较)的绘图,对角线子图的图样。默认情况取决于是否使用“hue”
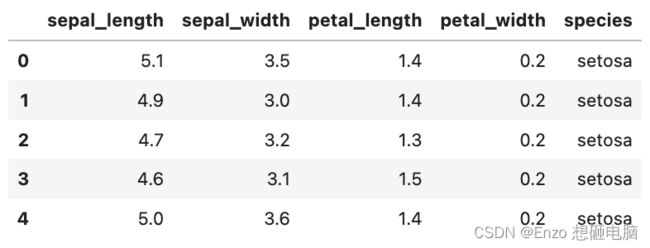
读取 鸢尾花 的数据集,其有四个特征:花萼长度、花萼宽度、花瓣长度、花瓣宽度,查看两两之间的数据关系
iris = pd.read_csv(r'../input/seaborn-data/iris.csv')
iris.head()
sns.pairplot(iris)
sns.pairplot(iris, hue="species", markers=["o", "s", "D"])
