使用Prometheus Grafana 监控MySQL
本文旨在方便本人总结梳理,其他同学如果有这方面的需求建议查看参考资料中的链接中的博文,感谢各位博主的分享
下面是我们安装时用到的架构图

安装prometheus:
下载安装Prometheus(https://prometheus.io/download/)
wget https://github.com/prometheus/prometheus/releases/download/v1.6.2/prometheus-1.6.2.linux-amd64.tar.gz
tar xvf prometheus-1.6.2.linux-amd64.tar.gz
cd prometheus-1.6.2.linux-amd64
解压后的目录结构:
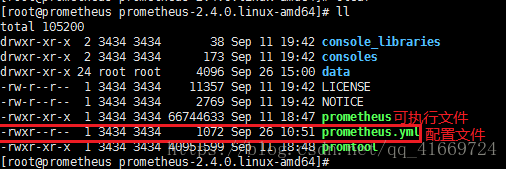
修改Prometheus配置文件prometheus.yml (替换你要监控的IP地址):

其中targets:['IP:Port']
IP是我们数据库主机的IP,端口则是对应的exporter的监听端口。
启动Prometheus(要注意 prometheus.yml 配置文件的位置,下面的命令是在 可执行文件prometheus 同级目录下)
./prometheus --config.file=prometheus.ymlPrometheus启动后可以访问web界面,我们可通过http://monitor_host:9090进行访问进行访问:

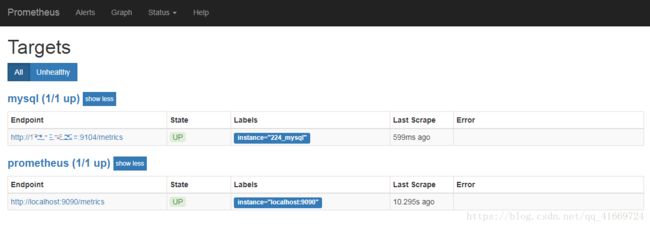
在Status->Targets页面下,我们可以看到我们配置的Target,它们的State为DOWN。

下一步我们需要安装并运行exporter,下载exporters并解压到被监控端服务器(注意:exporter是安装在被检测的服务器上):
wget https://github.com/prometheus/mysqld_exporter/releases/download/v0.10.0/mysqld_exporter-0.10.0.linux-amd64.tar.gz
tar xvf mysqld_exporter-0.10.0.linux-amd64.tar.gz
安装运行mysqld_exporter
创建.my.cnf文件并运行mysqld_exporter:
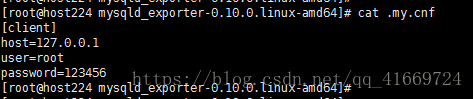
./mysqld_exporter -config.my-cnf .my.cnf![]()
然后再返回到监控的页面查看状态:
安装运行Grafana
这个是安装到监控服务器上
1、下载rpm源并进行安装
wget https://s3-us-west-2.amazonaws.com/grafana-releases/release/grafana-5.1.3-1.x86_64.rpm
sudo yum localinstall grafana-5.1.3-1.x86_64.rpm
运行grafana并登陆
启动grafana
systemctl start grafana-server
systemctl enable grafana-server
启动后查看状态:

启动后访问 http://monitor_host:3000进行访问进行访问,用户名、密码:admin/admin

点击添加数据源:
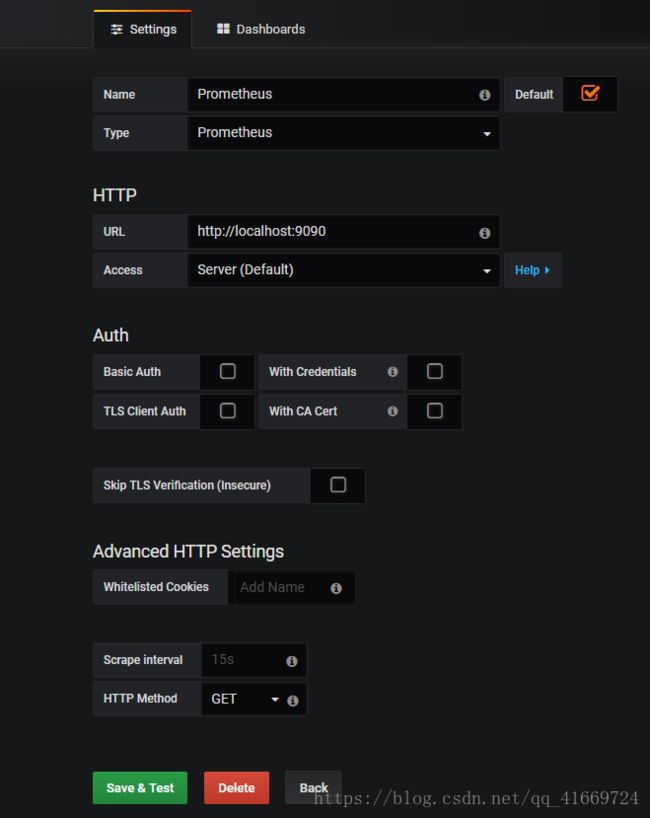
点击保存,然后添加grafana的监控规则,

这里你需要从https://github.com/percona/grafana-dashboards项目中的dashboards下载MySQL_Overview.json,然后通过上面页面的Upload .json File按钮上传上去,导入即可

导入成功后,你将看到监控页面。

参考资料:
使用Prometheus+Grafana监控MySQL实践: http://www.ywnds.com/?p=9656
Prometheus+Grafana搭建监控系统:https://blog.csdn.net/hfut_wowo/article/details/78536022
grafana+prometheus快速搭建MySql监控系统实践 :https://blog.csdn.net/u013431141/article/details/81633229
grafana+ prometheus+php 监控系统实践:https://segmentfault.com/a/1190000015876636
Prometheus官网的非官方中文手册:https://www.kancloud.cn/cdh0805010118/prometheus/719339
https://github.com/yunlzheng/prometheus-book
https://songjiayang.gitbooks.io/prometheus/content/
感谢以上博主的无私分享,由于时间原因部分截图是借用参考博文中的截图,本文旨在方便本人总结梳理,其他同学如果有这方面的需求建议查看以上博文