《动手深度学习》2.4微积分
《动手深度学习》2.4微积分 & 2.5自动微分
-
- 微积分
-
-
- 定义:取极限
- matplotlib绘图相关(拓展内容)
-
- 这两条曲线的简单绘制方法
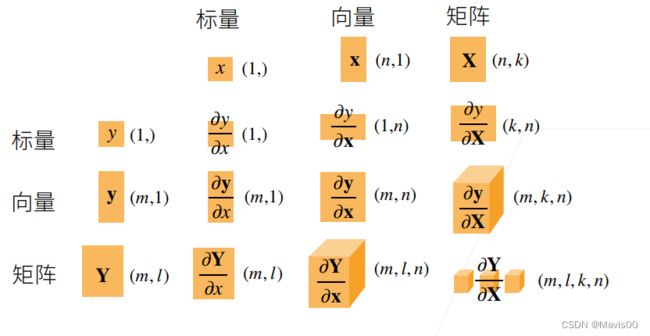
- 多元函数微分(向量/矩阵微分)——偏导数
-
- 拓展到矩阵求导
-
- python语法补充:
-
-
- **print(f'....')**
-
微积分
定义:取极限
- 定义一个函数
import numpy as np
from IPython import display
import torch
def f(x):
    return 3 * x ** 2 - 4 * x
- 取不同的h值,观察结果
def calculate_f(f,x,h):
    #求给定x=1处,不同h对应的(f(x+h)-f(x))/h的值
    return (f(x+h)-f(x))/h

h = 0.1
for i in range(5):
    print(f'h:{h:.5f}, x=1处导数的极限值为{calculate_f(f,1,h):.5f}')
    h *= 0.1
matplotlib绘图相关(拓展内容)
在这一部分,书中定义了一些绘图相关的函数,是没有内置的函数,后续还会经常用到。通过@save标记,可以将自定义函数、类或语句保存在d2l包中,后续无需再定义即可使用(如d2l.use_svg_display())
- use_svg_display(): 指定matplotlib软件包输出svg图表以获得更清晰的图像。
def use_svg_display(): #@save
    """使用svg矢量图格式在jupyter中显示绘图"""
    display.set_matplotlib_formats('svg')
- set_figsize()函数:设置图表大小
from matplotlib import pyplot as plt #可以直接d2l.plt,因为这个语句已经保存在d2l包中
def set_figsize(figsize=(3.5, 2.5)): #@save
    """设置图表大小"""
    use_svg_display()
    plt.rcParams['figure.figsize'] = figsize
    #rcParams['xxx']在rc配置文件中对属性进行设置
- set_axis()函数:设置轴的属性
#@save
def set_axes(axes, xlabel, ylabel, xlim, ylim, xscale, yscale, legend):
    """设置matplotlib的轴"""
    #xlabel,ylabel是坐标轴的名称:如plt.xlabel("x_label")设置x轴上的名字为x_label
    #xlim,ylim是x,y坐标轴的显示范围,如plt.xlim((0,2)), plt.ylim((-2,2))等等
    axes.set_xlabel(xlabel)
    axes.set_ylabel(ylabel)
    axes.set_xscale(xscale)
    axes.set_yscale(yscale)
    axes.set_xlim(xlim)
    axes.set_ylim(ylim)
    if legend:
        axes.legend(legend)
        #在legend方法的参数中需要设置labels,如果没有设置,那么就会使用调plot()函数时指定的label参数的名称,当然如果都没有的话就会抛出异常;
    axes.grid()
- plot函数
相关参数详解:matplotlib.pyplot中plt的参数详解
#@save
def plot(X, Y=None, xlabel=None, ylabel=None, legend=None, xlim=None,
         ylim=None, xscale='linear', yscale='linear',
         fmts=('-', 'm--', 'g-.', 'r:'), figsize=(3.5, 2.5), axes=None):
    """绘制数据点"""
    #参数fmt='[color][marker][line]',定义图的属性:颜色color、点型marker、线型line
    if legend is None:
        legend = []

    set_figsize(figsize)
    axes = axes if axes else plt.gca() #get current axes获取当前坐标轴,即自动设定的轴参数

    # 如果X是一个一维数组,输出True
    def has_one_axis(X):
        return (hasattr(X, "ndim") and X.ndim == 1 or isinstance(X, list)
                and not hasattr(X[0], "__len__"))
                #如果X是一个numpy数组,则它会有"ndim"参数,表明这个X是几维的,此处X作为横坐标,必须是一维的,即X.ndim == 1;
                #如果X是一个list(isinstance()用于判定X的type),那么必须要求X的元素即X[0]是个标量,"__len__"是list类型的一个属性,而标量没有这个属性

    if has_one_axis(X):
        X = [X]
    if Y is None:
        X, Y = [[]] * len(X), X
    elif has_one_axis(Y):
        Y = [Y]
    if len(X) != len(Y):
        print(X,Y) #输出一下就看出来了,此时X是一个一维数组,但是Y是二维的(因为对应两条曲线)
        X = X * len(Y) #将X也变成和Y一样的维数
    axes.cla() #用于清除当前轴
    for x, y, fmt in zip(X, Y, fmts):
        #下方绘制的例子是进行了2次循环,绘制两个函数,对应的fmt为'-'和'm--'
        if len(x):
            axes.plot(x, y, fmt)
        else:
            axes.plot(y, fmt)
    set_axes(axes, xlabel, ylabel, xlim, ylim, xscale, yscale, legend)
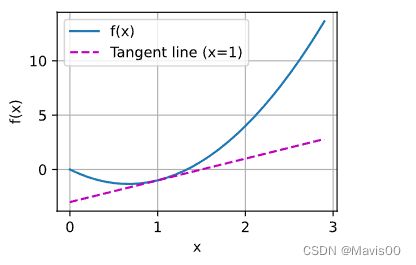
- 应用:用plot函数绘制函数切线图
x = np.arange(0, 3, 0.1)
plot(x, [f(x), 2 * x - 3], 'x', 'f(x)', legend=['f(x)', 'Tangent line (x=1)'])
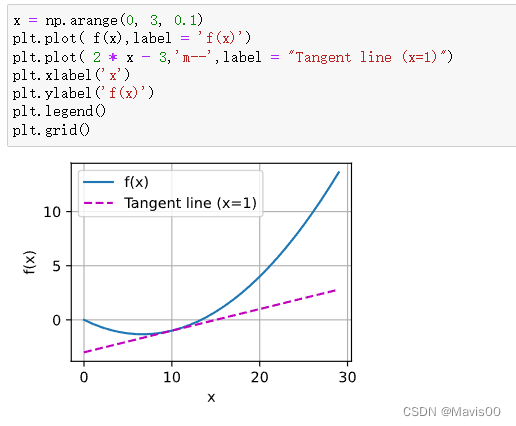
这两条曲线的简单绘制方法
上述函数构建是为了便于日后复用,但其实直接绘制很简单的啦~
x = np.arange(0, 3, 0.1)
plt.plot( f(x),label = 'f(x)')
plt.plot( 2 * x - 3,'m--',label = "Tangent line (x=1)")
plt.xlabel('x')
plt.ylabel('f(x)')
plt.legend()
plt.grid()
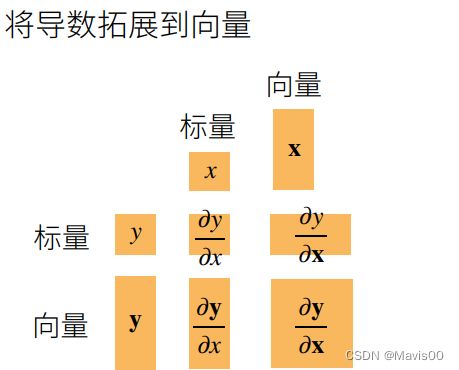
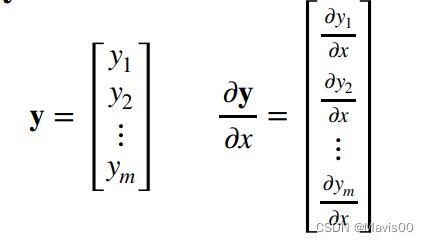
多元函数微分(向量/矩阵微分)——偏导数
拓展到矩阵求导
python语法补充:
print(f’…')
print字符串前面加f表示格式化字符串,加f后可以在字符串里面使用用花括号括起来的变量和表达式,如果字符串里面没有表达式,那么前面加不加f输出应该都一样
w = 2
print('%.2f' %w)
print(f'w = {w:.2f}')


