python 离散点线拟合插值
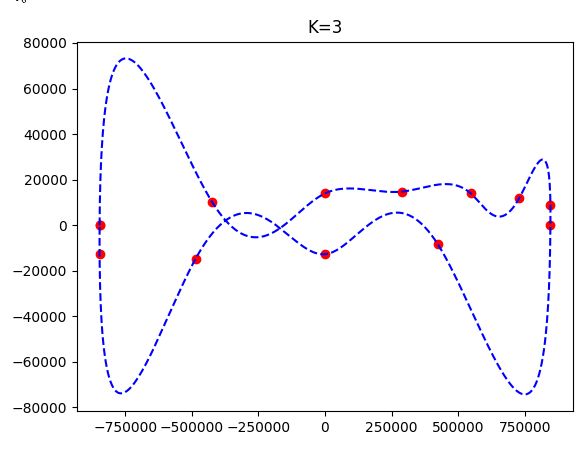
离散点拟合闭合曲线scipy.interpolate
import numpy as np
from scipy.interpolate import interp1d, splprep, splev, CubicHermiteSpline
import matplotlib.pyplot as plt

pts = np.array(
    [
        [-846724, 0],
        [-423362, 10029],
        [0, 13942],
        [289000, 14733],
        [547558, 13942],
        [730000, 11948],
        [846746, 9015],
        [846746, 0],
        [423373, -8311],
        [0, -12759],
        [-486000, -14733],
        [-846724, -12759],
        [-846724, 0],
    ]
)

tck, u = splprep(pts.T, u=None, s=0, k=1, per=1)
# 0.45 is chosen to get roughly the part not covered by the piecewise spline demo
u_new = np.linspace(u.min() + 0.45, u.max(), 1000)
x_new, y_new = splev(u_new, tck, der=0)


fix, axs = plt.subplots()

axs.plot(x_new, y_new, "b-")


def derivative_via_neighbors(index) -> float:
    delta = pts[index + 1] - pts[index - 1]
    return delta[1] / delta[0]


for i in range(5):
    spline = CubicHermiteSpline(
        pts[i : i + 2, 0],
        pts[i : i + 2, 1],
        [derivative_via_neighbors(i), derivative_via_neighbors(i + 1)],
    )
    spline_x = np.linspace(*spline.x)
    spline_y = spline(spline_x)
    axs.plot(spline_x, spline_y, "r--")


axs.plot(pts[:, 0], pts[:, 1], "ro")
# axs.set_aspect("equal", "box")
plt.show()
import numpy as np
from scipy.interpolate import interp1d, splprep, splev
import matplotlib.pyplot as plt
pts = np.array([
[-846724, 0],
[-423362, 10029],
[0, 13942],
[289000, 14733],
[547558, 13942],
[730000, 11948],
[846746, 9015],
[846746, 0],
[423373, -8311],
[0, -12759],
[-486000, -14733],
[-846724, -12759],
[-846724, 0]])
tck, u = splprep(pts.T, u=None, s=0, k=1, per=1)
u_new = np.linspace(u.min(), u.max(), 1000)
x_new, y_new = splev(u_new, tck, der=0)
plt.plot(pts[:,0], pts[:,1], 'ro')
plt.plot(x_new, y_new, 'b--')
plt.show()Scipy插值函数
导入插值模块
一维插值函数interp1d
二维插值函数
样条插值函数
#导入插值模块from scipy import interpolate
#导入插值模块
from scipy import interpolate
#导入插值模块
#__all__ = ['interp1d', 'interp2d', 'spline', 'spleval', 'splmake', 'spltopp',
 #          'ppform', 'lagrange', 'PPoly', 'BPoly', 'RegularGridInterpolator',
  #         'interpn']

import numpy as np
import matplotlib.pyplot as plt

#导入插值模块
from scipy.interpolate import interp1d

#生成数据
x = np.linspace(0, 1, 30)
y = np.sin(5*x) + np.cos(10*x)

#**一维插值函数***#
#零次插值
y0 = interp1d(x, y, kind='zero')
#一次插值
y1 = interp1d(x, y, kind='linear')
#二次插值
y2 = interp1d(x, y, kind='quadratic')
#三次插值
y3 = interp1d(x, y, kind='cubic')

#新变量
new_x = np.linspace(0, 1, 100)
#绘图
plt.figure()
plt.plot(x, y, 'o', label='data')
plt.plot(new_x, y0(new_x), label='zero')
plt.plot(new_x, y1(new_x), label='linear')
plt.plot(new_x, y2(new_x), label='quadratic')
plt.plot(new_x, y3(new_x), label='cubic')
plt.title("interp1d")
plt.xlabel("x")
plt.ylabel("f(x)")
plt.legend()
plt.show()
二维插值函数
import numpy as np
import matplotlib.pyplot as plt

#导入插值模块
from scipy.interpolate import interp2d

#生成数据
x = np.linspace(0, 1, 20)
y = np.linspace(0, 1, 30)
xx, yy = np.meshgrid(x, y)
rand = np.random.rand(600).reshape([30, 20])
z = np.sin(xx**2) + np.cos(yy**2) + rand

new_x = np.linspace(0, 1, 100)
new_y = np.linspace(0, 1, 100)

#**样条插值函数插值函数***#
#一次插值
z1 = interp2d(x, y, z, kind='linear')
new_z1 = z1(new_x, new_y)

#三次插值
z3 = interp2d(x, y, z, kind='cubic')
new_z3 = z3(new_x, new_y)

#绘图
plt.figure()
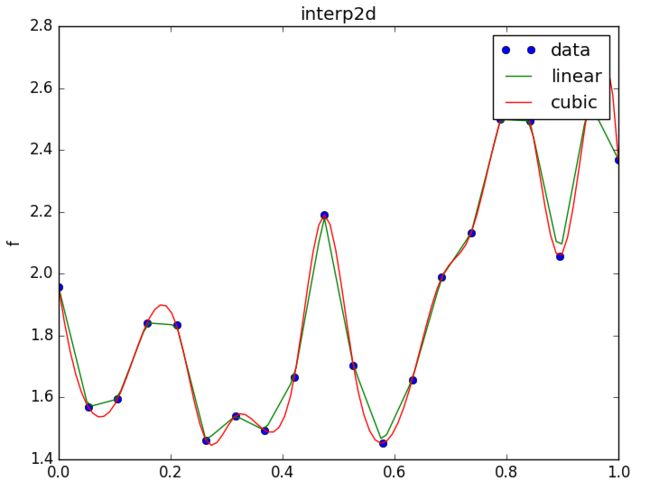
plt.plot(x, z[0, :], 'o', label='data')
plt.plot(new_x, new_z1[0, :], label='linear')
plt.plot(new_x, new_z3[0, :], label='cubic')
plt.title("interp2d")
plt.xlabel("x")
plt.ylabel("f")
plt.legend()
plt.show()

#用矩阵显示z
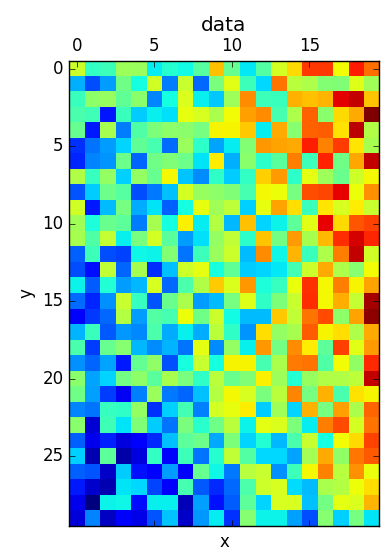
plt.matshow(z)
plt.title("data")
plt.xlabel("x")
plt.ylabel("y")
plt.show()

#用矩阵显示z
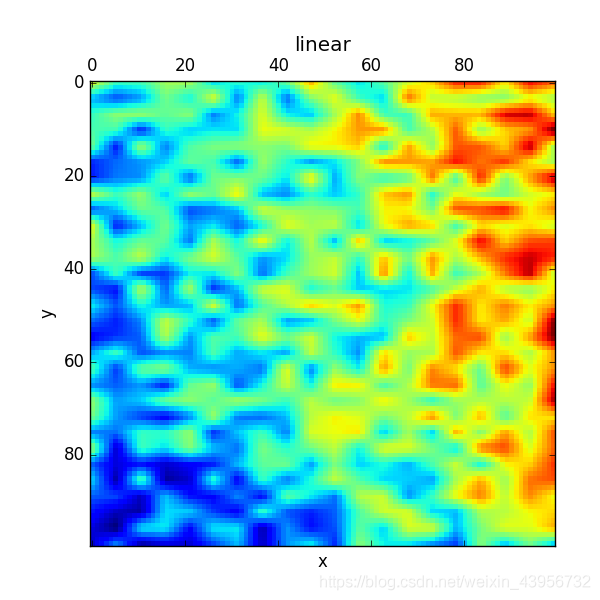
plt.matshow(new_z1)
plt.title("linear")
plt.xlabel("x")
plt.ylabel("y")
plt.show()

#用矩阵显示z
plt.matshow(new_z3)
plt.title("cubic")
plt.xlabel("x")
plt.ylabel("y")
plt.show()
二维插值显示:原始
线性插值效果
三次插值图
样条插值函数
import numpy as np
import matplotlib.pyplot as plt

#导入插值模块
from scipy.interpolate import spline

#生成数据
x = np.linspace(0, 1, 30)
y = np.sin(5*x) + np.cos(10*x) + np.random.rand(30)
new_x = np.linspace(0, 1, 100)

#**样条插值函数插值函数***#
#零次插值
y0 = spline(x, y, new_x, order=0, kind='smoothest')
#一次插值
y1 = spline(x, y, new_x, order=1, kind='smoothest')
#二次插值
y2 = spline(x, y, new_x, order=2, kind='smoothest')
#三次插值
y3 = spline(x, y, new_x, order=3, kind='smoothest')

#绘图
plt.figure()
plt.plot(x, y, 'o', label='data')
plt.plot(new_x, y0, label='zero')
plt.plot(new_x, y1, label='linear')
plt.plot(new_x, y2, label='quadratic')
plt.plot(new_x, y3, label='cubic')
plt.title("spline")
plt.xlabel("x")
plt.ylabel("f")
plt.legend()
plt.show()
ref:
https://stackoverflow.com/questions/70734630/scipy-interpolate-smooth-closed-curve
https://www.runoob.com/scipy/scipy-interpolation.html
https://blog.csdn.net/jajit/article/details/120176508
https://blog.csdn.net/weixin_43956732/article/details/106437583


