数据分布的一些检验方法
数据分布的一些检验方法
- 1.KS检验
- 2.幂律分布检验
- 3.雅克-贝拉检验(Jarque-Bera test)
- 4.安德森-达令检验(Anderson-Darling Test)
1.KS检验
Kolmogorov–Smirnov 检验,简称KS检验,是统计学中的一种非参数假设检验,用来检测单样本是否服从某一分布,或者两样本是否服从相同分布。当p值>=0.5时,可认为数据符合对应检验的分布。
下面以检验正态分布为例
from scipy.stats import kstest
import numpy as np
import pandas as pd
np.random.seed(10)
n = np.random.randn(10000)
n = pd.DataFrame(n)
p = kstest(n[0], "norm", N=len(n))
print(p)
2.幂律分布检验
符合y = c * x ^ (-r)的数据分布为幂律分布,是一种比较特殊的分布,且在我们的生活时常出现,我这里的检验思路就是两边各自取对数转换成lny = lnc - rlnx,然后进行线性拟合,如果拟合效果较好,可以说明此数据符合幂律分布。
# coding:utf-8
from sklearn import linear_model
import pandas as pd
import numpy as np
import matplotlib.pyplot as plt
import seaborn as sns
import matplotlib as mpl
from scipy.stats import kstest

mpl.rcParams['font.sans-serif'] = ['FangSong']  # 指定中文字体
mpl.rcParams['axes.unicode_minus'] = False  # 解决保存图像是负号'-'显示为方块的问题
plt.rcParams['font.sans-serif'] = ['SimHei']
plt.rcParams['axes.unicode_minus'] = False  # 正常显示负号

f = pd.read_csv("文件名.tsv", sep="\t", encoding="utf-8", low_memory=False)
col = "待检验的数据列名"
d = f[(~f[col].isnull())][col]
data = d.value_counts(normalize=True)  # 计算出现概率
data = pd.DataFrame([list(data.index), list(data)]).T
data.columns = ["x", "y"]
data["x"] = np.log(data["x"])  # 对数转换
data["y"] = np.log(data["y"])
sns.distplot(f[(~f[col].isnull())][col], rug=True, hist=True, kde=True, color="g")  # 粗略看一下数据分布图
plt.show()
reg = linear_model.LinearRegression()  # 线性拟合
reg.fit(np.array(data["x"]).reshape(-1, 1), np.array(data["y"]))
pre = reg.predict(np.array(data["x"]).reshape(-1, 1))
data["pre"] = pd.DataFrame(pre)
fig = plt.figure(figsize=(15, 8), dpi=80)
ax1 = fig.add_subplot(111)
ax1.scatter(data["x"], data["y"])
ax2 = ax1.twiny()
ax2.plot(data["x"], data["pre"], color="r")
plt.show()

print(reg.coef_)  # 求出的-r
print(reg.intercept_)  # 求出的lnc
print(reg.score(np.array(data["x"]).reshape(-1, 1)  # 计算R平方,检验拟合效果
np.array(data["y"])))

# 检验正太分布
p = kstest(f[col], "norm", N=len(f[col]))
print(p)
下面展示我的结果
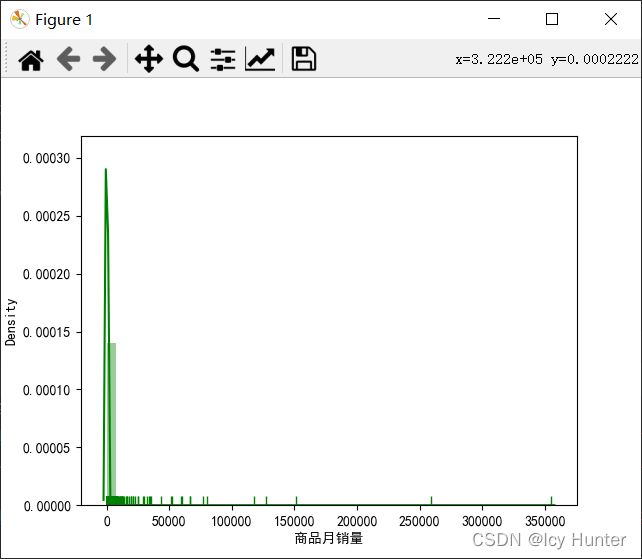
数据分布粗略图,看起来有点像幂律分布

对数转换后的散点图和拟合直线的图,看得出散点确实挺像一条直线的


R^2 = 0.5495, 怎么说呢,说明拟合效果是有一点的吧
下面的正态分布检验p=0.0说明数据不符合正态分布
因此,目前看来,认为这组数据为幂律分布。
3.雅克-贝拉检验(Jarque-Bera test)
计算方法可以参考
python进行JB正态性检验
下面使用scipy实现
import numpy as np
import scipy.stats as stats
np.random.seed(100)
norm = np.random.randn(10000)
exp = np.random.exponential(size=100)

p = stats.jarque_bera(norm)
print(p)  # (JB统计量, p-value)  p >= 0.5说明符合正太分布

p = stats.jarque_bera(exp)
print(p)
4.安德森-达令检验(Anderson-Darling Test)
Anderson-Darling检验,支持’norm’正态分布、'expon’指数分布,'logistic’分布,以及’gumbel’耿贝尔分布的检验,它会返回一个包含不同显著性水平下的p值的列表,而不是一个单一的p值,因此这可以更全面地解释结果。
import numpy as np
import scipy.stats as stats

np.random.seed(80)
data_norm = np.random.randn(100000)
p = stats.anderson(data_norm, dist='norm')
print(p)
'''
 If the returned statistic is larger than these critical values then
    for the corresponding significance level, the null hypothesis that
    the data come from the chosen distribution can be rejected.
    The returned statistic is referred to as 'A2' in the references.
如果输出的统计量值statistic < critical_values,则表示在相应的significance_level下,
接受原假设,认为样本数据来自给定的数据分布。'''
运行结果
AndersonResult(statistic=0.6249376112828031,
critical_values=array([0.576, 0.656, 0.787, 0.918, 1.092]),
significance_level=array([15. , 10. ,  5. ,  2.5,  1. ]))
这里statistic均小于critical_value,说明在1%-15%的显著性水平下,均认为数据符合正太分布。
