数据可视化编程题练习
数据可视化编程部分练习
- python
python
使用pandas、numpy、seaborn、matplotlib
- 使用Seaborn绘制条形图,展示2014年12月31日北京地区PM2.5的变化情况。
import seaborn as sns
import matplotlib.pyplot as plt
import pandas as pd

# 请在下方作答 #
##将数据框df_air中的time变量转化为datetime格式
air["time"] = pd.to_datetime(air['time'])

##设置seaborn绘图风格
sns.set(style='ticks')
## 创建大小为(10, 5)的图形,返回Figure对象fig
fig = plt.figure(figsize = (10, 5))

## 添加X轴标签为time,字体大小为15
plt.xlabel('time',fontsize=15)
## 添加Y轴标签为PM2.5,字体大小为15
plt.ylabel('PM2.5',fontsize=15)
##设置图形的标题为PM2.5 of Beijing,字体大小为20
plt.title('PM2.5 of Beijing',fontsize=20)
##使用plot()函数绘制折线图
plt.plot(air['time'],air['PM2.5'])
plt.show()
import matplotlib.pyplot as plt
import seaborn as sns

# 请在下方作答 #
##设置seaborn绘图风格和调色盘
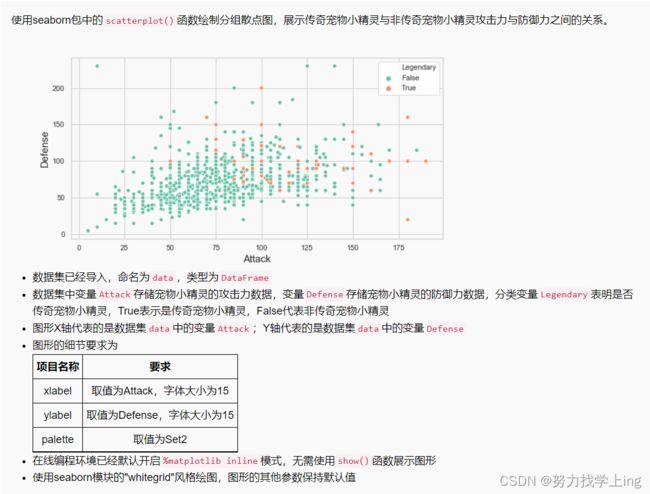
sns.set(style="whitegrid")

##创建大小为(10, 5)的图形,返回Figure对象fig
fig = plt.figure(figsize = (10,5))


## 添加X轴标签为Attack,字体大小为15
plt.xlabel("Attack",fontsize=15)

## 添加Y轴标签为Defense,字体大小为15
plt.ylabel("Defense",fontsize=15)

##使用scatterplot()函数绘制分组散点图,使用参数hue进行分组
sns.scatterplot(data=data,x='Attack',y='Defense',hue='Legendary',palette='Set2')
import matplotlib.pyplot as plt
import seaborn as sns

##设置seaborn绘图风格
sns.set_style('whitegrid')

##创建大小为(8, 5)的图形,返回Figure对象fig
fig = plt.figure(figsize=(8,5))

##将X轴的刻度标签存储在列表中
order=['<2 hours','2 to 5 hours','5 to 10 hours','>10 hours']

##使用boxplot()函数绘制箱线图,使用参数order调整X轴刻度标签顺序
sns.boxplot(x='studytime',y='final score',data = data,order =['<2 hours','2 to 5 hours','5 to 10 hours','>10 hours'],color='b',showmeans=True,notch=True)

## 添加X轴标签为Study Time,字体大小为15
plt.xlabel('Study Time',fontsize = 15)

## 添加Y轴标签为Final Score,字体大小为15
plt.ylabel('Final Score',fontsize = 15)
import pandas as pd
import matplotlib.pyplot as plt
data = pd.read_csv('coronary.csv')

## 创建大小为(10, 5)的图形,返回Figure对象fig
fig = plt.figure(figsize=(10, 5))

## 绘制折线图
Ldl = data['Ldl'][0:50]
plt.title('Line chart')
plt.plot(list(np.arange(50)),list(Ldl), color='deeppink', linestyle='--', marker='*')
import pandas as pd
import matplotlib.pyplot as plt
data = pd.read_csv('Candy_data.csv')

## 创建大小为(20, 5)的图形,返回Figure对象fig
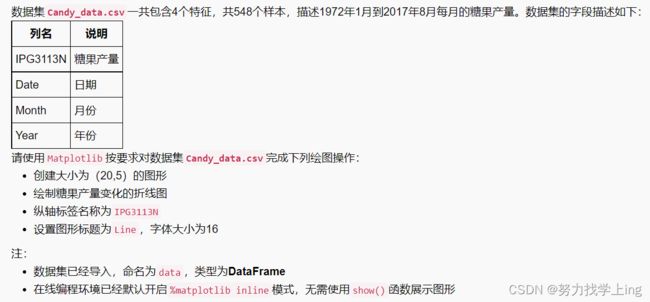
fig = plt.figure(figsize=(20,5))

## 添加Y轴标签
plt.ylabel('IPG3113N')

##设置图形的标题
plt.title('Line',fontsize=16)

##使用plot()函数绘制折线图
plt.plot(np.arange(548),data['IPG3113N'])
import pandas as pd
import seaborn as sns
import matplotlib.pyplot as plt

reviews = pd.read_csv("winemag.csv", index_col=0)
## 创建大小为(10, 5)的图形,返回Figure对象fig
fig = plt.figure(figsize=(10, 5))

## 提取数据
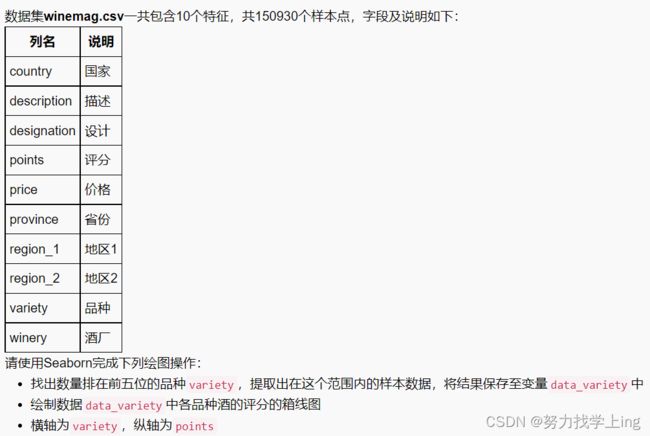
reviews_sort = reviews['variety'].value_counts(sort=True,ascending=False)
top5_variety = reviews_sort[0:5]
data_variety = reviews.loc[reviews['variety'].isin(list(top5_variety.index))]
data_variety = data_variety[['variety','points']]
## 绘图
sns.boxplot(x='variety',y='points',data=data_variety)


