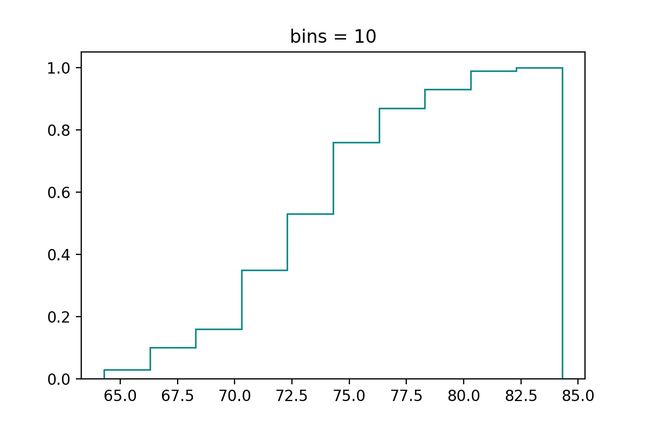
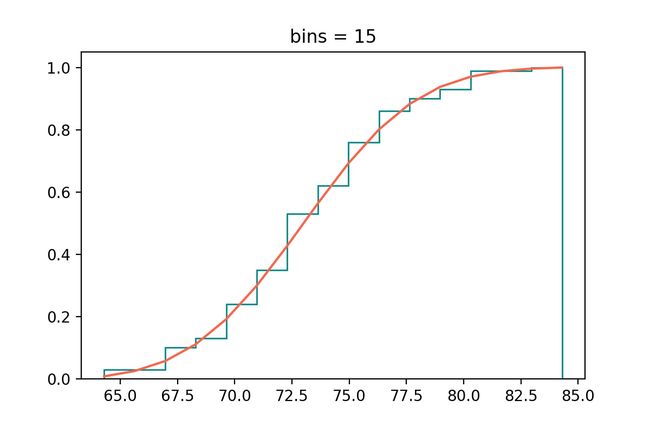
python 经验函数分布图 正态分布函数曲线拟合
数据分析朱老师课件上的代码。
但图像最后会骤降至0,这是代码的一个缺点,不知道怎么改进。
第二条曲线用了正态分布函数曲线进行拟合。
import numpy as np
import pandas as pd
import matplotlib.pyplot as plt

datas = np.array([64.3, 65.0, 65.0, 67.2, 67.3, 67.3, 67.3, 67.3, 68.0, 68.0, 68.8, 68.8, 68.8, 69.7,\
                  69.7, 69.7, 70.3,70.4, 70.4, 70.4, 70.4, 70.4,70.4, 70.4, 71.2, 71.2, 71.2, 71.2,\
                  72.0, 72.0, 72.0, 72.0, 72.0, 72.0, 72.0, 72.7, 72.7, 72.7, 72.7, 72.7, 72.7, 72.7,\
                  73.5, 73.5, 73.5, 73.5, 73.5, 73.5, 73.5, 73.5, 73.5,73.5, 73.5, 74.3, 74.3, 74.3,\
                  74.3, 74.3, 74.3, 74.3, 74.3, 74.7, 75.0, 75.0, 75.0, 75.0, 75.0, 75.0, 75.0, 75.4,\
                  75.6, 75.8, 75.8, 75.8, 75.8, 75.8, 76.5, 76.5, 76.5, 76.5, 76.5, 76.5, 76.5, 77.2,\
                  77.2,77.6, 78.0, 78.8, 78.8, 78.8, 79.5, 79.5, 79.5, 80.3, 80.5, 80.5, 81.2, 81.6,\
                  81.6, 84.3])

#数据特征计算
s = np.std(datas, ddof=1)#样本标准差
xbar = np.mean(datas)#样本均值

#数据可视化 画数据经验分布曲线图
nt, bins, patches = plt.hist(datas, bins=10, histtype='step', \
cumulative=True, density=True, color='darkcyan')#datas是数据,bins是分组数
plt.title('bins = 10')
plt.savefig('经验函数分布图1.jpg', dpi=200)
plt.show()

#数据可视化 画数据经验分布曲线图
nt, bins, patches = plt.hist(datas, bins=15, histtype='step', \
cumulative=True, density=True, color='darkcyan')#datas是数据,bins是分组数
plt.title('bins = 15')

#正态分布函数曲线拟合
y = (1 / (np.sqrt(2 * np.pi) * s)) * np.exp(-0.5 * ((bins - xbar) ** 2 / s ** 2))
y = y.cumsum()
y = y / y[-1]
plt.plot(bins, y, 'tomato', linewidth = 1.5, label = 'Theoretical')
plt.savefig('经验函数分布图2.jpg', dpi=200)
plt.show()

