**小程序使用echarts**
最近接到一个小程序项目,里面有图表之类的功能,自然而然的就想到了echarts。
为了兼容小程序 Canvas,官方提供了一个小程序的组件,用这种方式可以方便地使用 ECharts。
首先,下载 GitHub 上的 ecomfe/echarts-for-weixin 项目。
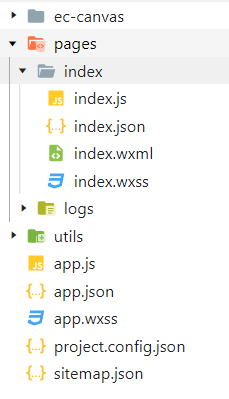
其中,ec-canvas 是我们提供的组件,其他文件是如何使用该组件的示例。
ec-canvas 目录下有一个 echarts.js,默认我们会在每次 echarts-for-weixin 项目发版的时候替换成最新版的 ECharts。如有必要,可以自行从 ECharts 项目中下载最新发布版,或者从官网自定义构建以减小文件大小。
下面是引用后的项目结构

我要在pages/index/index中使用,那么就先在index.js中引用,import * as echarts from '../../ec-canvas/echarts';(这是我项目的引用路径,根据自己项目做修改)
下面方法写在Page外,这样更新数据才能及时响应,数据暂时是假数据,请求接口数据直接在方法内请求即可(下面方法一个为折线图,一个为饼图),在小程序中使用与在web中使用没有太大区别
```javascript
var xData = ["1:00", "2:00", "3:00", "4:00", "5:00", "6:00", "7:00", "8:00", "9:00", "10:00", "11:00", "12:00", "13:00", "14:00", "15:00"],
yData = [100,250,360,585,458,985,652,154,265],
chart,
charts,
pc=180,
mobile=132;
function initChart(canvas, width, height) {
for(var i=0;i<15;i++){
yData[i]=Math.ceil(Math.random()*1000);
}
chart = echarts.init(canvas, null, {
width: width,
height: height
});
canvas.setChart(chart);
var option = {
color: ["#37A2DA"],
xAxis: {
type: 'category',
boundaryGap: false,
data: xData,
},
yAxis: {
x: 'center',
type: 'value'
},
series: [{
type: 'line',
smooth: true,
data: yData
}]
};
chart.setOption(option);
return chart;
}
function initCharts(canvas, width, height) {
charts = echarts.init(canvas, null, {
width: width,
height: height
});
canvas.setChart(charts);
var options = {
color: ["#3498DB", "#E062AE"],
tooltip: {
trigger: 'item',
formatter: "{a} {b}: {c} ({d}%)"
},
grid: {
left: 20,
right: 20,
bottom: 15,
top: 40,
containLabel: true
},
color: ['#ff7f50','#87cefa','#da70d6','#32cd32','#6495ed',
'#ff69b4','#ba55d3','#cd5c5c','#ffa500','#40e0d0',
'#1e90ff','#ff6347','#7b68ee','#00fa9a','#ffd700',
'#6699FF','#ff6666','#3cb371','#b8860b','#30e0e0'],
// visualMap: {
// show: false,
// min: 80,
// max: 600,
// color: ["#3498DB", "#E062AE","#333","#658","#999","#000","#345689","#125686","#145689","#157856","#854655","#456895","#658"],
// inRange: {
// colorLightness: [0, 1]
// }
// },
series: [
{
type: 'pie',
radius: '65%',
center: ['50%', '50%'],
label: {
normal: {
show: true,
position: 'outside',
formatter: '{b}:{c}'
},
emphasis: {
show: true,
textStyle: {
fontSize: '14',
fontWeight: 'bold'
}
}
},
data: [
{ value: 120, name: "移动端" },
{ value: 154, name:"PC端"},
{ value: 55, name: "移动端1" },
{ value: 78, name:"PC端1"},
{ value: 63, name: "移动端2" },
{ value: 48, name:"PC端2"},
{ value: 96, name: "移动端3" },
{ value: 14, name:"PC端3"}
].sort(function (a, b) { return a.value - b.value; }),
roseType: 'radius',
label: {
color: 'rgba(0, 0, 0, 1)'
},
labelLine: {
lineStyle: {
color: 'rgba(0, 0, 0, 1)'
},
smooth: 0.2,
length: 5,
length2: 20
},
itemStyle: {
shadowBlur: 200,
shadowColor: 'rgba(0, 0, 0, 0.5)'
},
animationType: 'scale',
animationEasing: 'elasticOut',
animationDelay: function (idx) {
return Math.random() * 200;
}
}
]
};
charts.setOption(options);
return charts;
}
```
方法完成后需要声明在Page/data中
```javascript
data: {
// motto: 'Hello World',
// userInfo: {},
// hasUserInfo: false,
// canIUse: wx.canIUse('button.open-type.getUserInfo'),
ec: {
onInit: initChart
},
ecs: {
onInit: initCharts
}
},
```
之后在index.wxml中挂载即可
```javascript
```
ECharts的方法在小程序中使用与外部使用没有明显差别,希望能够帮到大家,有什么不对的欢迎讨论!