python机器学习学习笔记(六)
支持向量机分类实例:用SVM分类器对Iris数据集分析并绘制分类图
1.线性
import numpy as np
import matplotlib.pyplot as plt
from sklearn import svm,datasets

iris = datasets.load_iris()
x = iris.data[:,:2]  #iris数据萼片的长和宽
y = iris.target
svc = svm.SVC(kernel='linear',C=1).fit(x,y)
x_min,x_max = x[:,0].min()-0.5,x[:,0].max()+0.5
y_min,y_max = x[:,1].min()-0.5,x[:,1].max()+0.5
h = 0.02
X,Y = np.meshgrid(np.arange(x_min,x_max,h),np.arange(y_min,y_max,h))
Z = svc.predict(np.c_[X.ravel(),Y.ravel()])
Z = Z.reshape(X.shape)

plt.contourf(X,Y,Z,alpha=0.4)
plt.contour(X,Y,Z,colors='k')
plt.scatter(x[:,0],x[:,1],c=y)
plt.show()
2.多项式
import numpy as np
import matplotlib.pyplot as plt
from sklearn import svm,datasets

iris = datasets.load_iris()
x = iris.data[:,:2]  #iris数据萼片的长和宽
y = iris.target
svc = svm.SVC(kernel='poly',C=1,degree=3).fit(x,y)
x_min,x_max = x[:,0].min()-0.5,x[:,0].max()+0.5
y_min,y_max = x[:,1].min()-0.5,x[:,1].max()+0.5
h = 0.02
X,Y = np.meshgrid(np.arange(x_min,x_max,h),np.arange(y_min,y_max,h))
Z = svc.predict(np.c_[X.ravel(),Y.ravel()])
Z = Z.reshape(X.shape)

plt.contourf(X,Y,Z,alpha=0.4)
plt.contour(X,Y,Z,colors='k')
plt.scatter(x[:,0],x[:,1],c=y)
plt.show()
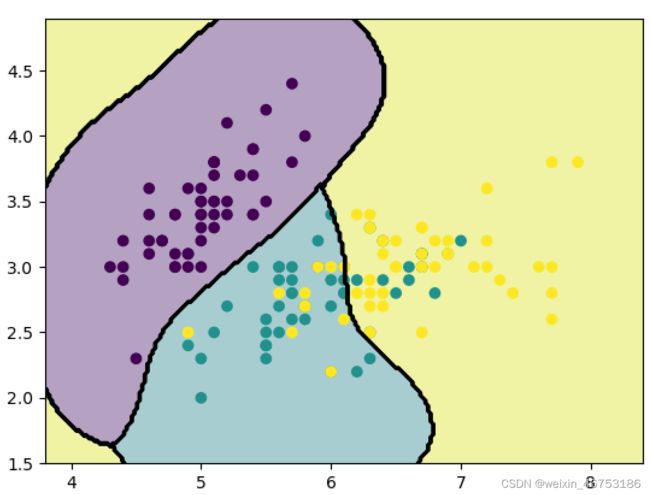
3.径向基函数RBF
import numpy as np
import matplotlib.pyplot as plt
from sklearn import svm,datasets

iris = datasets.load_iris()
x = iris.data[:,:2]  #iris数据萼片的长和宽
y = iris.target
svc = svm.SVC(kernel='rbf',C=1,gamma=3).fit(x,y)
x_min,x_max = x[:,0].min()-0.5,x[:,0].max()+0.5
y_min,y_max = x[:,1].min()-0.5,x[:,1].max()+0.5
h = 0.02
X,Y = np.meshgrid(np.arange(x_min,x_max,h),np.arange(y_min,y_max,h))
Z = svc.predict(np.c_[X.ravel(),Y.ravel()])
Z = Z.reshape(X.shape)

plt.contourf(X,Y,Z,alpha=0.4)
plt.contour(X,Y,Z,colors='k')
plt.scatter(x[:,0],x[:,1],c=y)
plt.show()
参考:
法比奥·内利. Python数据分析实战:第2版.北京:人民邮电出版社, 2019.11.


