拼多多用户优惠券使用行为预测分析项目
拼多多用户优惠券使用行为预测分析项目
-
-
- 一、项目分析背景
- 二、项目分析目标
- 三、项目分析内容
-
- 1. 数据预处理
-
- (1)导入所需库及数据集信息
- (2)了解数据基本情况
-
- 1)观察数据类型和数据量
- 2)观察数据集结构与内容
- 3)观察数值型变量的描述性统计情况
- 4)观察字符型变量的分类情况
- (3)数据清洗
-
- 1)数值型变量的离群值过滤
- 2)字符型变量(job变量)的噪声数据处理
- (4)特征类型转化
-
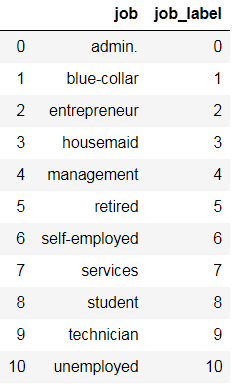
- 1)job变量(用户岗位详情)的数据类型转换
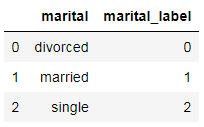
- 2)marital变量(用户婚姻状况)的数据类型转换
- 3)default变量(用户信用卡是否存在违约行为)的数据类型转换
- 4)returned变量(用户是否有过退货行为)的数据类型转换
- 5)loan变量(用户是否使用信用卡付款)的数据类型转换
- 2. 算法模型的学习与调参
-
- (1)模型建立
- (2)模型参数调整
- (3)连续性变量离散化后对模型的优化
-
- 1)连续性变量的离散化
- 2)重新构建模型
- 3. 模型的结果预测
-
- (1)模型中特征重要性分析
- (2)模型的结果预测
- 四、项目分析结论
-
- 1. 构建用户画像
-
- (1)用户年龄及用户职位详情
-
- 1)用户年龄分布情况
- 2)用户年龄与用户职位信息间相关关系
- (2)用户是否有过退货行为
- (3)用户在1个月内累计使用优惠券数量
- 2. 相关建议
-
一、项目分析背景
拼多多是国内主流的手机购物APP,成立于2015年9月,用户通过发起和朋友、家人、邻居等的拼团,以更低的价格,拼团购买商品。
拼多多作为新电商开创者,致力于将娱乐社交的元素融入电商运营中,通过“社交+电商”的模式,让更多的用户带着乐趣分享实惠,享受全新的共享式购物体验。
对于各大电商平台,在“双十一”这种大促时间段,优惠券会起到非常大的促销作用。那么,如何找到更容易使用优惠券的用户,对他们精准地推送与营销,从而在双十一期间促使销售额获得很大程度上的提升呢?这将是一个待分析和解决的问题。
二、项目分析目标
根据对已获取数据的分析和信息挖掘,构建具有较好泛化能力的预测模型,从而对导入模型的未知特征矩阵数据进行优惠券是否被使用的有效预测,是此次项目的主要实践目标。
通过对包含用户属性信息以及优惠券的累计使用情况的数据集进行算法模型的构建,来预测不同属性下的消费者在未来是否会产生优惠券的使用行为,从而提出关于针对性发放优惠券、提升优惠券使用率的相关决策建议。
三、项目分析内容
1. 数据预处理
(1)导入所需库及数据集信息
# 导入第三方库
import pandas as pd
import numpy as np
%matplotlib inline
import warnings
warnings.filterwarnings('ignore')

# 导入数据库
pdd= pd.read_csv('E:/数据分析课程/week seven(逻辑回归)/拼多多优惠券数据.csv')
pdd.set_index('ID',inplace=True)
(2)了解数据基本情况
1)观察数据类型和数据量
pdd.info()
- 通过上述观察可知,整个数据集共有4个数值型变量及5个字符型变量,包含25317个数据样本,且不存在缺失值。
2)观察数据集结构与内容
pdd.head()

通过对数据集的结构与内容进行观察可知,其包含8个特征及一个标签,特征矩阵中存有两个数据维度,分别为用户属性以及用户消费行为信息,如下是不同维度内的特征及标签列含义解读情况:
- 用户属性维度
- age:数值型变量,用户年龄
- job:字符型变量,用户岗位详情
- marital:字符型变量,用户婚姻状态
- default:字符型变量,信用卡是否存在违约行为
- 用户消费行为维度
- returned:字符型变量,用户是否有过退货行为
- loan:字符型变量,用户是否使用信用卡付款
- coupon_used_in_last6_month:数值型变量,用户在6个月内累计使用优惠券数量
- coupon_used_in_last_month:数值型变量,用户在1个月内累计使用优惠券数量
- 数据标签字段
- coupon_ind:数值型变量,用户是否在此次活动中使用优惠券
3)观察数值型变量的描述性统计情况
pdd.loc[:,pdd.columns!='coupon_ind'].describe([0.1,0.25,0.5,0.75,0.85,0.9,0.99,0.999]).T
-
age(用户年龄):最小值为18岁,最大值却达到了95岁,并且从分布情况来看90%以后的分布离散情况过于严重,存在一定的数据异常。首先,从数据本身入手,在99.9%处的年龄值为83岁,而最大值却达到了95岁,离散值偏离整体数据过远,存在异常。其次,从现实意义来看,95岁高龄的老年人不太可能使用拼多多软件进行购物,为此数据存在录入异常情况。后续会对异常值进行数据清洗。
-
coupon_used_in_last6_month(用户在6个月内累计使用优惠券数量):近50%的用户在6个月内仅使用过一张优惠券,而分布在75%后的用户的累计优惠券使用数量达到3张及以上,拉动整体使用数量的平均值达到了3张左右,这种现象符合帕累托定律(80/20法则),反映出拼多多近80%的优惠券使用量由仅20%的用户提供,从优惠券使用率的角度来看,拼多多存在高价值用户,后续需要有区分性的对高价值用户和一般用户制定优惠券推广策略,尝试推动一般用户提升优惠券的使用量,重点关注如何维护高价值用户的忠诚度。
除此之外,从整体分布以及合理性来看,数据存在异常值(离群值),后续需对其进行过滤,其目的是为了减少模型在学习过程中拟合效果出现偏差的可能性。
-
coupon_used_in_last_month(用户在1个月内累计使用优惠券数量):近75%的用户在近1个月内没有使用过优惠券,仅有分布在最后的15%左右的用户使用了1张及以上的优惠券。从整体上来看,优惠券累计使用数量的平均值仅为0.3,标准差值也不大,说明在近一个月内使用优惠券较多的用户数量占比很小,未能起到拉动整体平均使用量提升的效果,且数值分布较均衡,多数用户使用至多一张优惠券,仅存在极少量的离群值,可知拼多多在1个月内对优惠券的推广效果并不可观,需进一步改进优惠券的策略制定。
类似于用户在6个月内累计使用优惠券数量变量的情况,数据本身存在异常值(离群值),为此需要在后续进行数据过滤。
4)观察字符型变量的分类情况
# 构建字符型变量分类情况函数
def fun(group):
    m=pdd.groupby(group).count()['coupon_ind']
    n=pdd.count()['coupon_ind']
    lis=['{}%'.format(round(i*100/n,2)) for i in m]
    data=pd.DataFrame([m.index.tolist(),m.values.tolist(),lis]).T
    data.columns=['{}'.format(group),'total_num','percent']
    return data
# job变量(用户职位分类情况)
fun('job')
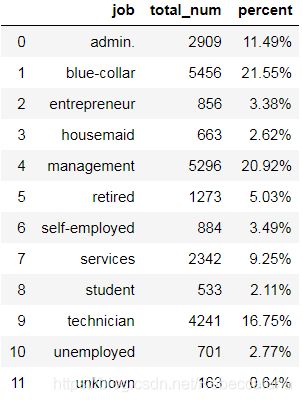
- job(用户职位信息):通过观察用户职位的分类情况可知,其共包含11个分类,分别为admin.、blue_collar、entrepreneur、housemaid、management、retired、self_employed、services、student、technician及unemployed,其中存在163个未知分类数据,后续需对这些噪声值进行适当的处理。
# marital变量(用户婚姻状况)
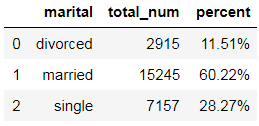
- marital(用户婚姻状况):通过观察用户婚姻状况的分类情况可知,其共包含3个分类,分别为divorced、married及single,该字段并不存在异常的分类情况。
# default变量(用户信用卡是否存在违约行为)
- default(用户信用卡是否存在违约行为):通过观察用户信用卡是否存在违约行为的分类情况可知,其共包含2个分类,分别为yes和no,且两者的分布情况非常不均衡,占比达到99:1。除此之外,该字段不存在异常分类情况。
# returned变量(用户是否有过退货行为)
fun('returned')
- returned(用户是否有过退货行为):通过观察用户是否有过退货行为的分类情况可知,其共包含2个分类,分别为yes和no,两者的分布情况较均衡,且该字段不存在异常分类情况。
# loan变量(用户是否使用信用卡付款)
fun('loan')
- loan(用户是否使用信用卡付款):通过观察用户是否使用信用卡付款的分类情况可知,其共包含2个分类,分别为yes和no,且两者的分布情况非常不均衡,占比达到5:1。除此之外,该字段不存在异常分类情况。
(3)数据清洗
1)数值型变量的离群值过滤
# 先过滤age字段离群值
des=pdd.loc[:,pdd.columns!='coupon_ind'].describe([0.1,0.25,0.5,0.75,0.9,0.99,0.999]).T
q3=des['75%']['age']
q1=des['25%']['age']
min_bound=q1-1.5*(q3-q1)
max_bound=q3+1.5*(q3-q1)
pdd=pdd.loc[(pdd['age']>min_bound)&(pdd['age']<max_bound)]
pdd.loc[:,pdd.columns!='coupon_ind'].describe([0.1,0.25,0.5,0.75,0.85,0.9,0.99,0.999]).T
- 利用箱线图的分布规律先过滤age字段的离群值,过滤掉<下四分位—1.5x(上四分位—下四分位)以及>上四分位+1.5x(上四分位—下四分位)的离群数据样本。通过对age字段的清洗可观察到离群值已经得到了有效的过滤,清洗了近300条异常值,数据总量还有25033条。
- 进一步观察描述性统计结果发现coupon_used_in_last6_month和coupon_used_in_last_month字段依旧存在较离谱的离群值,但是为了保证不大量减少该字段所包含的信息量,将不使用箱线图分布情况进行筛选方法,而是直接删除大于99.9%处数值的样本数据,避免过度损失字段信息。
# 过滤coupon_used_in_last6_month字段离群值
pdd=pdd.loc[pdd['coupon_used_in_last6_month']<des.loc
               ['coupon_used_in_last6_month','99.9%'],:]
# 过滤coupon_used_in_last_month字段离群值
pdd=pdd.loc[pdd['coupon_used_in_last_month']<des.loc
               ['coupon_used_in_last_month','99.9%'],:]
pdd.loc[:,pdd.columns!='coupon_ind'].describe([0.1,0.25,0.5,0.75,0.85,0.9,0.99,0.999]).T
- 通过对coupon_used_in_last6_month和coupon_used_in_last_month字段采用相同方式的异常值清洗,可得上述的描述性统计结果,数据总量剩余24952条。
2)字符型变量(job变量)的噪声数据处理
# 清洗job变量的噪声数据
pdd=pdd[pdd['job']!='unknown']
fun('job')
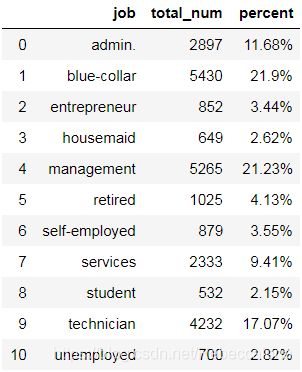
- 通过前面对job变量分类情况的分析,可以获知未知分类仅占总体的0.64%,异常值数据量较少且数据的填充值具有不确定性,为此可对其直接进行删除操作。
(4)特征类型转化
为了便于后续建立分类器模型,需提前将字符型数据转化为数值型数据。(sklearn中分类器无法处理字符型)
1)job变量(用户岗位详情)的数据类型转换
# 将job变量的11个类别分别用0-10来表示
from sklearn.preprocessing import LabelEncoder
le=LabelEncoder().fit_transform(pdd.job)
pdd['job_label']=le
m=list(pdd.groupby('job').count()['job_label'].index)
n=list(pdd.groupby('job_label').count()['job'].index)
show=pd.DataFrame(m,columns=['job'])
show['job_label']=n
- 使用数据预处理库中的LabelEncode对字符型数据进行编码处理,将字符型数据转化为0-10的数值型数据,便于后续分类器模型的建立。
2)marital变量(用户婚姻状况)的数据类型转换
# 将marital变量的3个类别分别用0-2来表示
le1=LabelEncoder().fit_transform(pdd.marital)
pdd['marital_label']=le1
m1=list(pdd.groupby('marital').count()['marital_label'].index)
n1=list(pdd.groupby('marital_label').count()['marital'].index)
show1=pd.DataFrame(m1,columns=['marital'])
show1['marital_label']=n1
- 处理方法同job变量,将用户婚姻状况字符型变量转化为3个类别,分别用0-2来表示。
3)default变量(用户信用卡是否存在违约行为)的数据类型转换
# 将default变量的2个类别分别0和1来表示
pdd['default_label']=pdd.default.apply(lambda x:0 if x=='no' else 1)
m2=list(pdd.default.unique())
n2=list(pdd.default_label.unique())
show2=pd.DataFrame(m2,columns=['default'])
show2['default_label']=n2
- 直接使用匿名函数将default变量进行二值化处理,no用0来表示,yes用1来表示。
4)returned变量(用户是否有过退货行为)的数据类型转换
# 将returned变量的2个类别分别0和1来表示
pdd['returned_label']=pdd.returned.apply(lambda x:0 if x=='no' else 1)
m3=list(pdd.returned.unique())
n3=list(pdd.returned_label.unique())
show3=pd.DataFrame(m3,columns=['returned'])
show3['returned_label']=n3
- 直接使用匿名函数将default变量进行二值化处理,no用0来表示,yes用1来表示。
5)loan变量(用户是否使用信用卡付款)的数据类型转换
# 将loan变量的2个类别分别0和1来表示
pdd['loan_label']=pdd.loan.apply(lambda x:0 if x=='no' else 1)
m4=list(pdd.loan.unique())
n4=list(pdd.loan_label.unique())
show4=pd.DataFrame(m4,columns=['loan'])
show4['loan_label']=n4
- 直接使用匿名函数将loan变量进行二值化处理,no用0来表示,yes用1来表示。
# 最终数据集内容如下所示
pddnew=pdd.loc[:,['job_label','marital_label','default_label','loan_label',                	                 'returned_label','age','coupon_used_in_last_month',
                  'coupon_used_in_last6_month','coupon_ind']]
pddnew.head()
2. 算法模型的学习与调参
项目本身是解决分类型问题,且数据集多包含离散型变量,此次将选择随机森林分类器作为项目的模型。
(1)模型建立
# 导入所需的sklearn模块
from sklearn.ensemble import RandomForestClassifier
from sklearn.model_selection import cross_val_score,train_test_split
# 利用学习曲线确定n_estimators参数最佳值
score1=[]
for i in range(80,101):
    rfc=RandomForestClassifier(n_estimators=i,random_state=10)
    score_=cross_val_score(rfc,x,y,cv=10).mean()
    score1.append(score_)
max_estimators=(score1.index(max(score1)))+80 # 最后结果为86
# 绘制可视化折线图确定最佳参数值及最高准确率
scatter1=go.Scatter(x=list(range(80,101)),y=score1,marker=dict(color='#c9422d'))
fig=go.Figure(scatter1)
fig.update_layout(
    plot_bgcolor='#FEFEFE',
    xaxis_title='n_estimators参数取值',
    yaxis=dict(title='准确率',gridcolor='#F1F0EF')
)
fig.show()
n_estimators参数学习曲线折线图
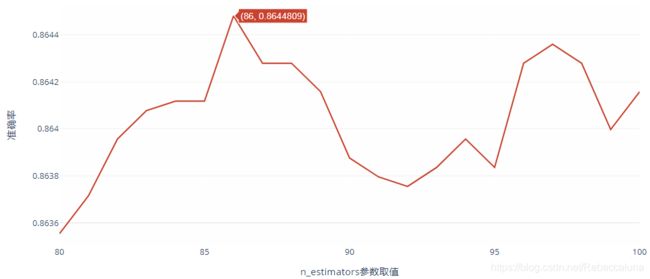
- n_estimators参数是一个超参数,偏向于越大所得结果越好,可通过绘制学习曲线确定,随着其参数值不断增加,不会影响模型的复杂程度,从而影响模型的泛化误差,为此可作为随机森林模型第一个调整的参数。
- 构建随机森林分类器后,利用交叉验证结果绘制n_estimators参数的学习曲线,确定最佳参数值为86。
(2)模型参数调整
# 判断模型处于何种拟合状态(欠拟合或者过拟合)
xtrain,xtest,ytrain,ytest=train_test_split(x,y,test_size=0.3,random_state=1)
rfc=RandomForestClassifier(n_estimators=86,random_state=10).fit(xtrain,ytrain)
score_test=rfc.score(xtest,ytest)
score_train=rfc.score(xtrain,ytrain)
print(score_train,score_test)
- 对训练集进行预测所获准确率为0.936,对测试集进行预测准确率为0.869,两者相差较大,表明现在模型处于过拟合状态(随机森林的基评估器决策树本是就是一个易过拟合的模型),接下来需要对模型进行剪枝操作,从而提升模型的泛化能力。
# 调整对模型复杂程度影响较大的max_depth
train_s=[]
test_s=[]
for i in range(1,15):
	rfc=RandomForestClassifier(n_estimators=86,max_depth=i,
                               random_state=10).fit(xtrain,ytrain)
    score_test=rfc.score(xtest,ytest)
    score_train=rfc.score(xtrain,ytrain)
    train_s.append(score_train)
    test_s.append(score_test)
# 绘制训练集和测试集在不同max_depth下的准确率
train_=go.Scatter(x=list(range(1,15)),y=train_s,
                  name='train_score',
                  marker=dict(color='#F8C0A5'))
test_=go.Scatter(x=list(range(1,15)),y=test_s,
                 name='test_score',
                 marker=dict(color='#c9422d'))
fig=go.Figure([train_,test_])
fig.update_layout(
    plot_bgcolor='#FEFEFE',
    xaxis_title='max_depth参数取值',
    yaxis=dict(title='准确率',gridcolor='#F1F0EF')
)
fig.show()
max_depth参数取值
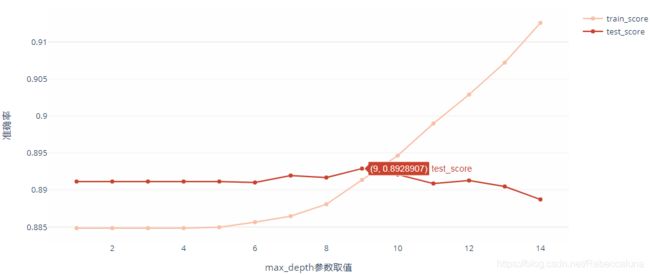
- 通过对max_depth参数的学习曲线绘制,可以确定当参数值为9时,训练集和测试集的准确率差距最小,且测试集的准确率具有所大幅度的提升,分别达到了0.891和0.893。
(3)连续性变量离散化后对模型的优化
根据连续性变量的分布情况,对其进行离散化处理,从而达到优化模型预测结果的效用。
1)连续性变量的离散化
- age变量(用户年龄)的离散化
# 观察用户年龄的分布情况
his=go.Histogram(x=list(pddnew.age.values),nbinsx=30,
                 histnorm='percent',
                 marker=dict(color='#c9422d'))
fig=go.Figure(his)
fig.update_layout(
    xaxis_title='年龄分布',
    yaxis=dict(title='所占整体比例',gridcolor='#F1F0EF'),
    plot_bgcolor='#FEFEFE'
)
fig.show()
年龄频率分布直方图
# 对数据集进行复制,暂时不在原数据集上做改动
pddnew_=pddnew.copy()
# age用户年龄变量的数据类型转换
age=[]
for i in list(pddnew.age.values):
    if i<=30:
        age.append('小于30')
    elif i>30 and i<=40:
        age.append('30-40')
    elif i>40 and i<=60:
        age.append('40-60')
    else:
        age.append('大于60')
# 通过编码的方式转化数据类型
pddnew_=pddnew.copy()
pddnew_['age_label']=LabelEncoder().fit_transform(age)
data_age=pd.DataFrame(set(age),columns=['age'])
data_age['age_label']=LabelEncoder().fit_transform(data_age.age)
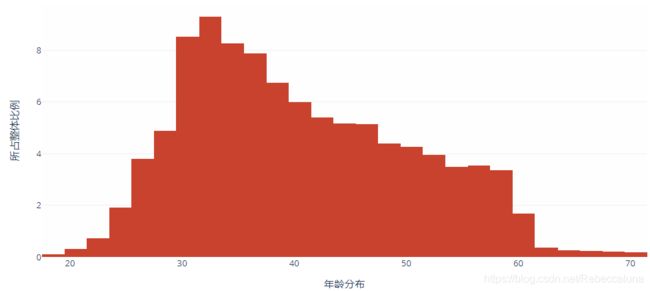
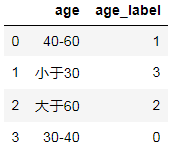
- 根据图像的分布情况所示,先将用户年龄连续性变量划分为以下几个区间,分别为<=30、30-40、40-60以及>60四个年龄分布区间。
- 根据年龄分布区间的设定,再将其通过编码的方式转化为数值型,便于后续模型的学习。
- coupon_used_in_last6_month变量(用户在6个月内累计使用优惠券数量)的离散化
# 观察用户在6个月内累计使用优惠券数量的分布情况
his=go.Histogram(x=list(pddnew.coupon_used_in_last6_month.values),nbinsx=32,
                 histnorm='percent',
                 marker=dict(color='#c9422d'))
fig=go.Figure(his)
fig.update_layout(
    xaxis_title='6个月内累计使用优惠券数量分布',
    yaxis=dict(title='所占整体比例',gridcolor='#F1F0EF',tickvals=np.arange(0,41,10)),
    plot_bgcolor='#FEFEFE'
)
fig.show()
用户在6个月内累计使用优惠券频率分布直方图
# 用户在6个月内累计使用优惠券数量变量的数据类型转换
used_6=[]
for i in list(pddnew.coupon_used_in_last6_month.values):
    if i<=2:
        used_6.append('2张以内')
    elif i>2 and i<=10:
        used_6.append('2-10张')
    else:
        used_6.append('超出10张')
# 通过编码的方式转化数据类型
pddnew_['used_6_label']=LabelEncoder().fit_transform(used_6)
data_used6=pd.DataFrame(set(used_6),columns=['used_6'])
data_used6['used_6_label']=LabelEncoder().fit_transform(data_used6.used_6)
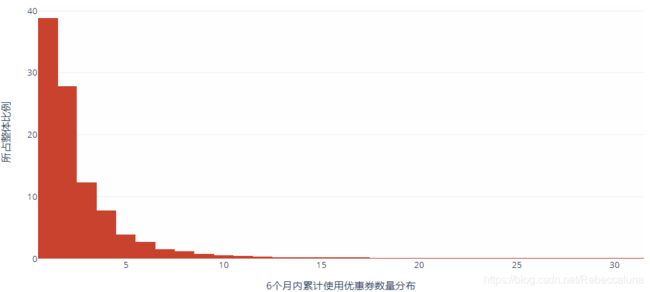
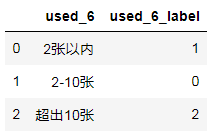
- 根据图像的分布情况所示,先将用户在6个月内累计使用优惠券数量字段的连续性变量划分为以下几个区间,分别为2张之内、2-10张以及超出10张三个分布区间。
- 根据用户6个月内累计使用优惠券数量分布区间的设定,再将其通过编码的方式转化为数值型,便于后续模型的学习。
- coupon_used_in_last_month变量(用户在1个月内累计使用优惠券数量)的离散化
# 观察用户在1个月内累计使用优惠券数量的分布情况
his=go.Histogram(x=list(pdd.coupon_used_in_last_month.values),nbinsx=18,
                 histnorm='percent',
                 marker=dict(color='#c9422d'))
fig=go.Figure(his)
fig.update_layout(
    width=600,
    xaxis_title='1个月内累计使用优惠券数量分布',
    yaxis=dict(title='所占整体比例',gridcolor='#F1F0EF',tickvals=np.arange(0,81,20)),
    plot_bgcolor='#FEFEFE'
)
fig.show()
用户在1个月内累计使用优惠券频率分布直方图
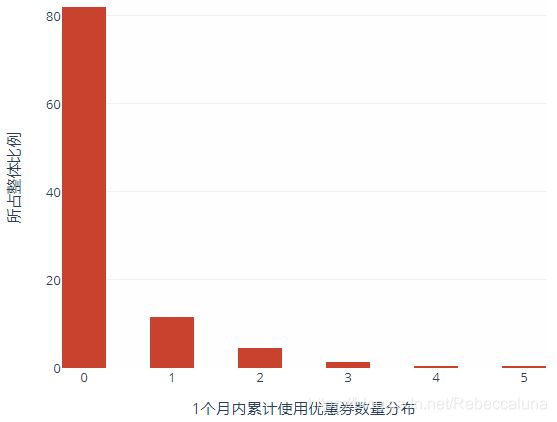
- 根据图像的分布情况所示,整体呈现出非常明显的使用数量分布区间,数据本身就是离散型的变量,为此将不进行进一步修改。
# 最终转化后数据类型后的数据集呈现
pddnew_.rename(columns={'coupon_used_in_last_month':'used_1_label'},inplace=True)
pddnew_.drop(columns=['age','coupon_used_in_last6_month'],inplace=True)
pddnew_=pddnew_.loc[:,['job_label','marital_label','default_label','loan_label',
                'returned_label','age_label','used_1_label','used_6_label','coupon_ind']]
pddnew_.head()
2)重新构建模型
x_=pddnew_.loc[:,pddnew_.columns!='coupon_ind']
y_=pddnew_.coupon_ind
xtrain_,xtest_,ytrain_,ytest_=train_test_split(x_,y_,test_size=0.3,random_state=10)
rfc_=RandomForestClassifier(n_estimators=86,max_depth=9,
                            random_state=10).fit(xtrain_,ytrain_)
rfc.score(xtest_,ytest_)# 所得结果并未由明显提升,为此以未进行数据离散化前的数据集为准

# 最终模型如下
x=pddnew.loc[:,pddnew.columns!='coupon_ind']
y=pddnew['coupon_ind']
xtrain,xtest,ytrain,ytest=train_test_split(x,y,test_size=0.3,random_state=1)
rfc=RandomForestClassifier(n_estimators=86,max_depth=9,
                               random_state=10).fit(xtrain,ytrain)
score_test=rfc.score(xtest,ytest)
score_train=rfc.score(xtrain,ytrain)
print('训练集准确率:{},测试集准确率:{}'.format(score_train,score_test))
![]()
-
通过调整变量的数据类型发现,所得结果与未进行调整之前相差无几,为此可以将为调整数据类型前的模型确定为最终模型,训练集准确率和测试集准确率分别为0.891和0.893。
-
t通过对模型结果的迭代优化,基本构建出具有较优泛化能力的随机森林分类评估器,后续将利用模型对样本标签进行预测,根据预测结果构建出较易使用优惠券的用户画像。
3. 模型的结果预测
接下来将根据所建成的随机森林分类器模型,来预测训练集样本中用户是否使用优惠券的情况,并对不同优惠券使用情况下的用户属性及用户行为进行细化分析。
(1)模型中特征重要性分析
# 模型特征重要性
impo=rfc.feature_importances_.tolist()
feature=pddnew.loc[:,pddnew.columns!='coupon_ind'].columns.tolist()
data=pd.DataFrame({'feature_names':feature,'importances':impo})
data=data.sort_values('importances',ascending=False)
data.index=range(len(impo))
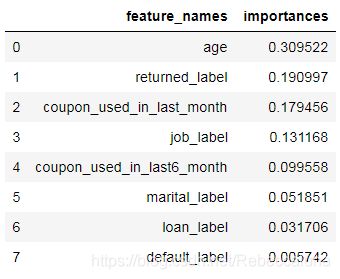
- 分析特征对于模型建立的重要性,可知用户年龄、用户是否有过退货行为、用户在1个月内累计使用优惠券数量以及用户职位详情四个特征对模型的影响程度较大,重要程度较高。
(2)模型的结果预测
# 是否使用优惠券的预测
ypredict=rfc.predict_proba(x)
label_0=[]
label_1=[]
for i in ypredict.tolist():
    label_0.append(i[0])
    label_1.append(i[1])
pdd_=x
pdd_['proba_not_use']=label_0
pdd_['proba_use']=label_1
pdd_.head()
- 利用predict_proba属性返回优惠券使用情况分类下的概率情况,当一方概率大于0.5时,将其样本的预测结果判定为所属分类。
# 用户是否使用优惠券的概率筛选
p=pdd_.loc[pdd_['proba_use']>0.75,:]
p.head()
- 筛选得出具有75%可能性会使用优惠券的样本数据,而非直接利用predict属性来获取用户具有50%的优惠券使用可能性,提升用户使用优惠券可能性的筛选条件,更有助于后续对用户属性及行为对优惠券使用情况影响的准确分类分析。
四、项目分析结论
根据上述分析可知,用户年龄、用户是否有过退货行为、用户在1个月内累计使用优惠券数量以及用户职位详情四个特征对模型的重要程度较高,为此,这四个特征将作为构建用户画像的主要考量因素。
1. 构建用户画像
(1)用户年龄及用户职位详情
1)用户年龄分布情况
# 绘制用户年龄分布直方图
age_h=go.Histogram(x=list(p.age.values),nbinsx=25,
                 histnorm='percent',
                 marker=dict(color='#c9422d'))
fig=go.Figure(age_h)
fig.update_layout(
    width=800,
    xaxis_title='用户年龄分布',
    yaxis=dict(title='所占整体比例',gridcolor='#F1F0EF',tickvals=np.arange(0,40,5)),
    plot_bgcolor='#FEFEFE'
)
fig.show()
用户年龄分布直方图
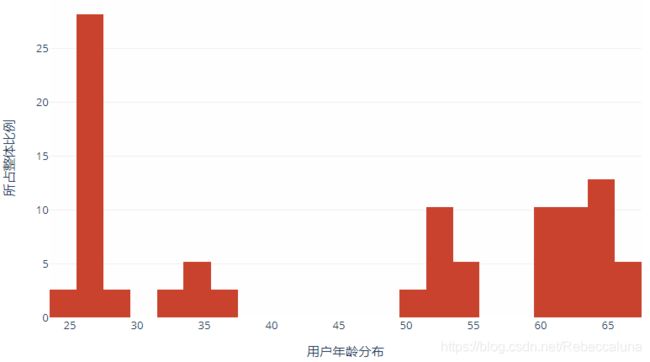
- 通过上述直方图所示,更加偏向于使用优惠券的用户,其年龄分布区间主要聚集在两个部分,分别为24-30岁以及60-67岁。
2)用户年龄与用户职位信息间相关关系
用户职位信息变量的分布情况过于松,且不具有一定规律,为此将其与用户年龄进行整体分析,从而得出更加具体且有意义的用户画像分析结果。
# 绘制用户年龄及用户职位信息间的散点图
s=go.Scatter(x=p.age,y=p.job_label,mode='markers',marker=dict(color='#c9422d'))
fig=go.Figure(s)
fig.update_layout(
    width=800,
    xaxis=dict(title='用户年龄',gridcolor='#F1F0EF'),
    yaxis=dict(title='用户职位信息',gridcolor='#F1F0EF'),
    plot_bgcolor='#FEFEFE'
)
fig.show()
用户年龄与用户职位信息相关关系散点图
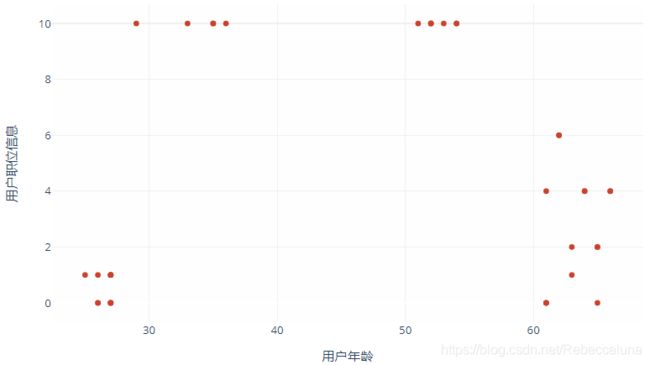
- 通过上述散点图分布所示,用户年龄分布在30-40以及50-55岁,且属于用户职位信息变量中unemployed类别下的用户,更加偏向于使用优惠券。
(2)用户是否有过退货行为
# 用户是否有过退货行为变量的分布情况
d=p.returned_label.describe([0.1,0.2,0.25,0.45,0.5,0.65,0.75,0.85,0.9])
pd.DataFrame(d).T
- 通过观察上述用户是否有过退货行为的描述性统计情况可知,偏向于使用优惠券的用户中,有超过75%的用户并未有过退货行为,大致可以推断出未产生退货行为的用户存在更大的可能性使用优惠券。
(3)用户在1个月内累计使用优惠券数量
# 用户在1个月内与在6个月内累计使用优惠券数量分布对比
p.loc[:,['coupon_used_in_last_month','coupon_used_in_last6_month']].describe(
    	[0.1,0.2,0.25,0.4,0.5,0.6,0.75,0.8,0.9]).T
- 根据上述描述性统计分析结果可知,用户在近1个月内产生过使用优惠券的行为更易在下一次销售活动或者消费中使用优惠券。
- 除此之外,对比1个月和6个月下用户累计使用优惠券数量的分布情况可以发现,两者的数值分布情况几乎保持一致,大致可以断定这些用户为拼多多近1个月内的新用户,之前并未有过使用优惠券行为,其全部的优惠券使用数量都集中在近1个月内。
2. 相关建议
-
构建用户画像,定位目标用户,有针对性的发放优惠券,从而提升优惠券使用率,并且间接达到促进拼多多销售额提升的效用。
-
拼多多在有针对性的发放优惠券时,需重点关注近1个月内新注册,年龄分布在24-30岁及60-67岁范围内,且很大程度上没有产生过退货行为的新用户,这类用户需被看作发放优惠券的重要目标,不仅可以提升优惠券的使用率,也可达到促进销售的效果。
-
除此之外,也可将无雇佣状态下的用户看作优惠券的重点发放对象,这类用户对优惠券的需求较大,对其进行优惠券的批量发放,可以提升优惠券的使用率,并且易于将其培养成拼多多的忠实用户。但由于这类用户的数量并不可观,为此,仅从优惠券的使用率方面考虑,具有较优异的效果,不会起到促进销售的效用。
