第一章 监控知识基本概述
1.为什么要使用监控
1.对系统不间断实时监控
2.实时反馈系统当前状态
3.保证服务可靠性安全性
4.保证业务持续稳定运行
2.如何进行监控,比如我们需要监控磁盘的使用率
1.如何查看磁盘使用率 df -h
2.监控磁盘的那些指标 block、 inode
3.如何获取具体的信息 df -h|awk '//[图片上传失败...(image-e053a6-1573890926426)]
(NF-1)}'
4.获取的数值到达多少报警 80%
3.流行的监控工具
1.Zabbix
2.Lepus(天兔)数据库监控系统
3.Open-Falcon 小米
4.Prometheus(普罗米修斯, Docker、 K8s)
4.如果去到一家新公司,如何入手监控
1.硬件监控 路由器、交换机、防火墙
2.系统监控 CPU、内存、磁盘、网络、进程、 TCP
3.服务监控 nginx、 php、 tomcat、 redis、 memcache、 mysql
4.WEB 监控 请求时间、响应时间、加载时间、
5.日志监控 ELk(收集、存储、分析、展示) 日志易
6.安全监控 Firewalld、 WAF(Nginx+lua)、安全宝、牛盾云、安全狗
7.网络监控 smokeping 多机房
8.业务监控 活动引入多少流量、产生多少注册量、带来多大价值
第二章 单机时代如何监控
CPU 监控命令: w、 top、 htop、 glances
%Cpu(s):0.3 us,0.3 sy,0.0 ni,99.3 id,0.0 wa,0.0 hi,0.0 si,0.0 stus用户态:跟用户的操作有关 35%sy系统态:跟内核的处理有关 60%id CPU空闲:
内存监控命令: free
[root@m01~]# free-h total used free shared buff/cache availableMem:977M105M724M6.6M148M729MSwap:1.0G0B1.0G
磁盘监控命令: df、 iotop
Device: tps kB_read/s kB_wrtn/s kB_read kB_wrtnsda 0.80 25.32 33.36 221034 291193设备名 每秒传输次数 每秒读大小 每秒写大小 读的总大小 写的总大小
网络监控命令: ifconfig、 route、 glances、 iftop、 nethogs、 netstat
单位换算Mbps100Mbps/8MB12MBiftop 中间的<==>这两个左右箭头,表示的是流量的方向。TX:发送流量、RX:接收流量、TOTAL:总流量#查看 TCP11 中状态netstat-an|grepESTABLISHEDnetstat-rn# 查看路由信息netstat-lntup
2.随着时间的推移,用户不断的增多,服务随时可能扛不住会被 oom(out of memory),当系统内存不足的时候,会
触发 oom
1.当系统内存不足的时候就会大量使用 swap
2.当系统大量使用 swap 的时候,系统会特别卡
注意: 有时可能内存还有剩余 300Mb-500Mb,但会发现 swap 依然被使用
[root@ZabbixServer~]# ddif=/dev/zeroof=/dev/nullbs=800M[root@ZabbixServer~]# tail-f/var/log/messagesOutofmemory:Kill process2227(dd)score778or sacrifice childKilled process2227(dd)total-vm:906724kB,anon-rss:798820kB,file-rss:0kB
3.那单机时代,如何使用 shell 脚本来实现服务器的监控
需求: 每隔 1 分钟监控一次内存,当你的可用内存低于 100m,发邮件报警,要求显示剩余内存
1.怎么获取内存可用的值 free -m|awk '/^Mem/{print $NF}'
2.获取到内存可用的值如何和设定的阈值进行比较
3.比较如果大于 100m 则不处理,如果小于 100 则报警
4.如何每隔 1 分钟执行一次
[root@ZabbixServer ~]# cat free.sh#!/usr/bin/bashHostName=$(hostname)_$(hostname -i)Date=$(date +%F)while true;doFree=$(free -m|awk '/^Mem/{print $NF}')if [ $Free -le 100 ];thenecho "$Date: $HostName Mem Is < ${Free}MB"fisleep 5done
第三章 zabbix 监控快速安装
1.配置zabbix仓库
[root@m01~]# rpm-ivh https://mirrors.tuna.tsinghua.edu.cn/zabbix/zabbix/4.0/rhel/7/x86_64/zabbix-release-4.0-1.el7.noarch.rpm
2.安装 Zabbix 程序包,以及 MySQL、 Zabbix-agent
[root@m01~]# yum install-y zabbix-server-mysql zabbix-web-mysql zabbix-agent mariadb-server[root@m01~]# systemctl start mariadb.service&&systemctl enable mariadb.service
3.创建 Zabbix 数据库以及用户
[root@m01~]# mysqladmin password123456[root@m01~]# mysql-uroot-p123456MariaDB[(none)]>create database zabbix charactersetutf8 collate utf8_bin;MariaDB[(none)]>grant all privileges on zabbix.*to zabbix@localhost identified by'zabbix';MariaDB[(none)]>flush privileges;
4.导入 Zabbix 数据至数据库中
[root@m01~]# zcat/usr/share/doc/zabbix-server-mysql-4.0.11/create.sql.gz|mysql-uzabbix-pzabbix zabbix
5.编辑/etc/zabbix/zabbix_server.conf 文件,修改数据库配置
[root@m01~]# grep "^[a-Z]" /etc/zabbix/zabbix_server.conf ...............DBHost=localhostDBName=zabbixDBUser=zabbixDBPassword=zabbix...............
6.启动 Zabbix 服务进程,并加入开机自启
[root@m01~]# systemctl start zabbix-server.service[root@m01~]# systemctl enable zabbix-server.service
7.配置 Apache 的配置文件/etc/httpd/conf.d/zabbix.conf,修改时区
[root@m01~]# grep"Shanghai"/etc/httpd/conf.d/zabbix.conf php_value date.timezone Asia/Shanghai
8.重启 Apache Web 服务器
[root@m01~]# systemctl start httpd
第四章 WEB安装步骤
1.浏览器打开地址:http://10.0.1.61/zabbix/setup.php

image
2.检查依赖项是否存在异常
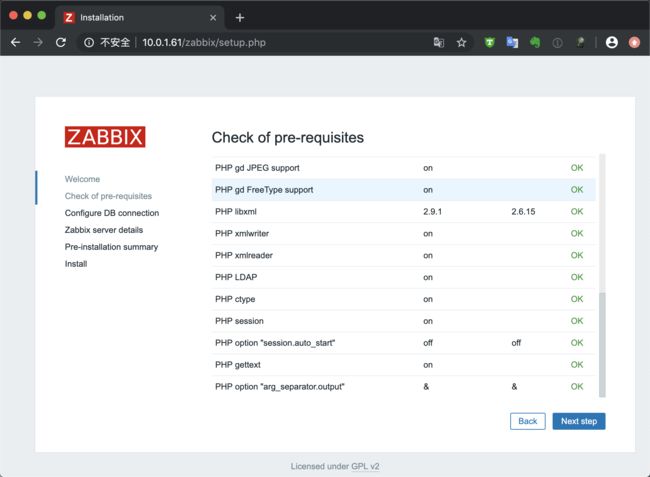
image
3.配置zabbix连接数据库
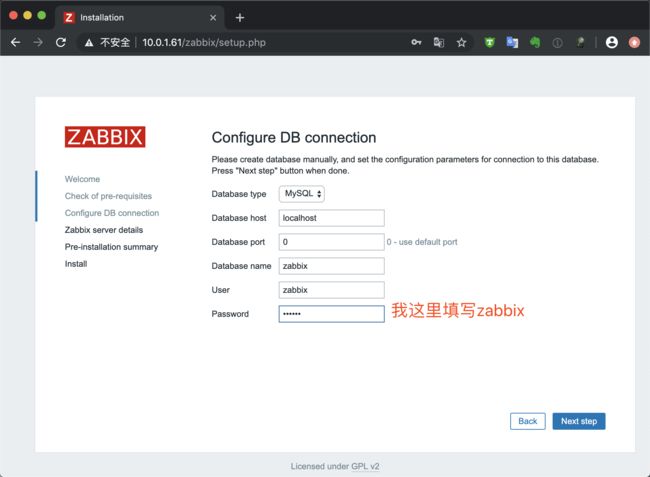
image
4.配置 ZabbixServer 服务器的信息

image
5.最终确认检查
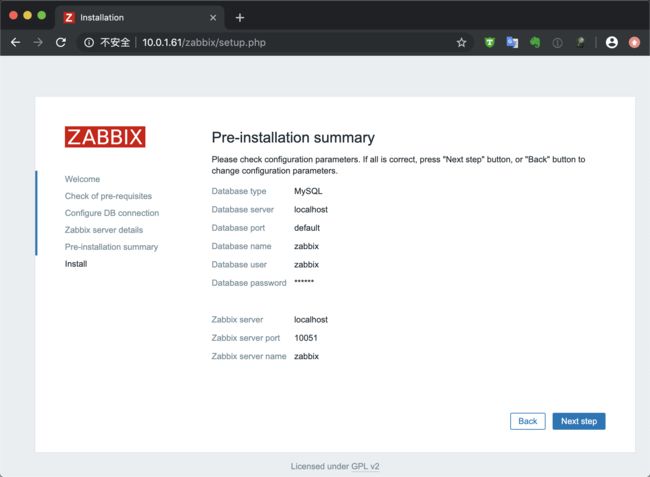
image
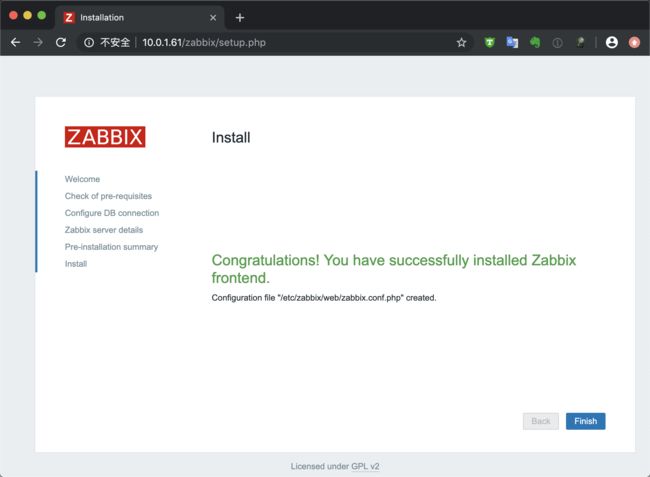
6.安装成功
提示已成功地安装了 Zabbix 前端。配置文件/etc/zabbix/web/zabbix.conf.php 被创建。
image
7.登陆zabbix
默认登陆 ZabbixWeb 的用户名 Admin,密码 zabbix
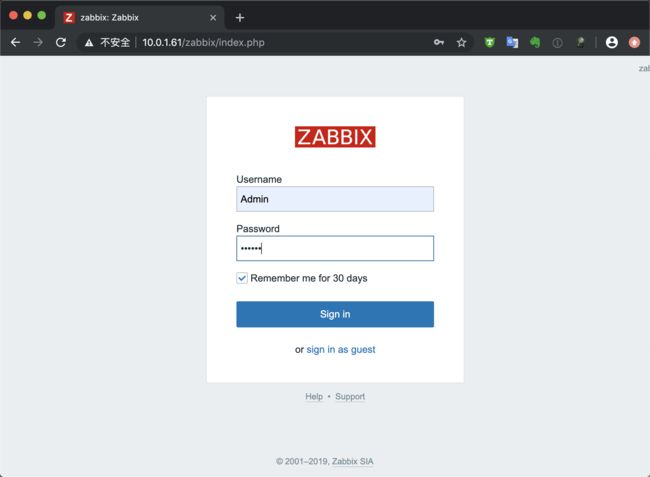
image
8.调整字符集为中文
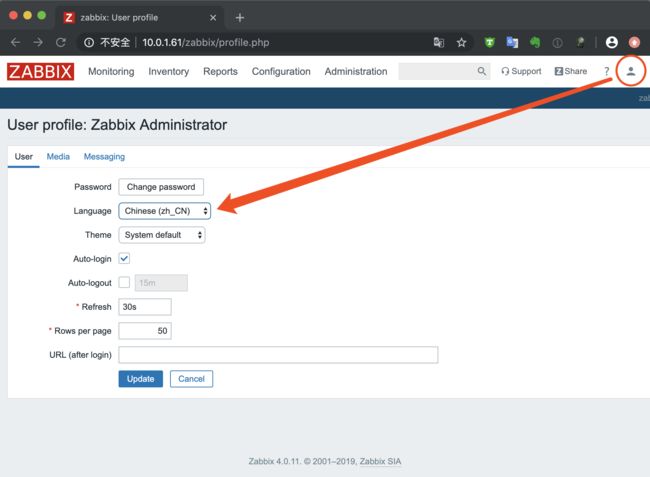
image
image
9.修复中文乱码
打开图形之后会发现语言为乱码,原因是缺少字体
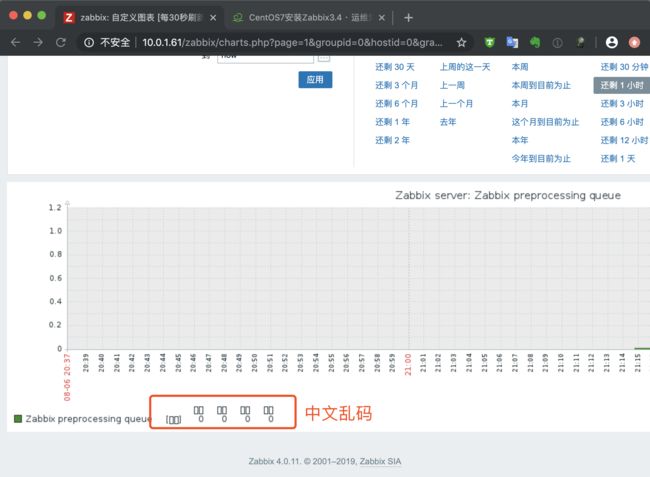
image
解决方法:安装字体并替换现有字体
[root@m01~]# yum install wqy-microhei-fonts-y[root@m01~]# cp/usr/share/fonts/wqy-microhei/wqy-microhei.ttc/usr/share/zabbix/assets/fonts/graphfont.ttf
再次刷新发现已经变成中文了

image
第五章 Zabbix 监控基础架构
zabbix-agent(数据采集)—>zabbix-server(数据分析|报警)—> 数据库(数据存储)<—zabbix web(数据展示)

image
第六章 zabbix 快速监控主机
1.安装zabbix-agent
[root@web01~]# rpm-ivh https://mirror.tuna.tsinghua.edu.cn/zabbix/zabbix/4.0/rhel/7/x86_64/zabbix-agent-4.0.11-1.el7.x86_64.rpm
2.配置zabbix-agent
[root@web01~]# grep "^[a-Z]" /etc/zabbix/zabbix_agentd.conf PidFile=/var/run/zabbix/zabbix_agentd.pidLogFile=/var/log/zabbix/zabbix_agentd.logLogFileSize=0Server=10.0.1.61ServerActive=127.0.0.1Hostname=ZabbixserverInclude=/etc/zabbix/zabbix_agentd.d/*.conf
3.启动zabbix-agent并检查
[root@web01~]# systemctl start zabbix-agent.service [root@web01~]# systemctl enable zabbix-agent.service[root@web01~]# netstat -lntup|grep 10050tcp000.0.0.0:100500.0.0.0:*LISTEN10351/zabbix_agentd tcp600:::10050:::*LISTEN10351/zabbix_agentd
4.zabbix-web界面,添加主机
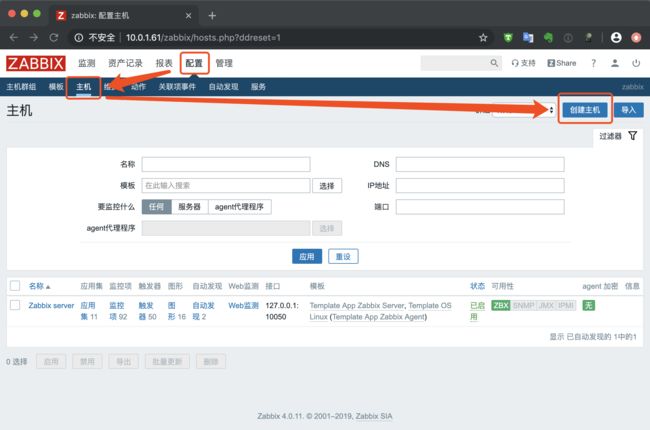
image

image

image
第七章 自定义监控主机小试身手
1.监控需求
监控TCP11种状态集
2.命令行实现
[root@web01~]# netstat-ant|grep-cTIME_WAIT55[root@web01~]# netstat-ant|grep-cLISTEN12
3.编写zabbix监控文件(传参形式)
[root@web01 ~]# cat /etc/zabbix/zabbix_agentd.d/tcp_status.conf UserParameter=tcp_state[*],netstat -ant|grep -c $1root@web01 ~]# systemctl restart zabbix-agent.service
4.server端进行测试
[root@m01~]# rpm-ivh https://mirrors.tuna.tsinghua.edu.cn/zabbix/zabbix/4.0/rhel/7/x86_64/zabbix-release-4.0-1.el7.noarch.rpm[root@m01~]# yum install zabbix-get.x86_64-y[root@m01~]# zabbix_get-s10.0.1.7-k tcp_state[TIME_WAIT]51[root@m01~]# zabbix_get-s10.0.1.7-k tcp_state[LISTEN]12
5.web端添加

image

image
6.克隆监控项
由于TCP有多种状态,需要添加多个监控项,我们可以使用克隆快速达到创建的效果

image

image
image
其他的状态依次添加即可
7.创建图形
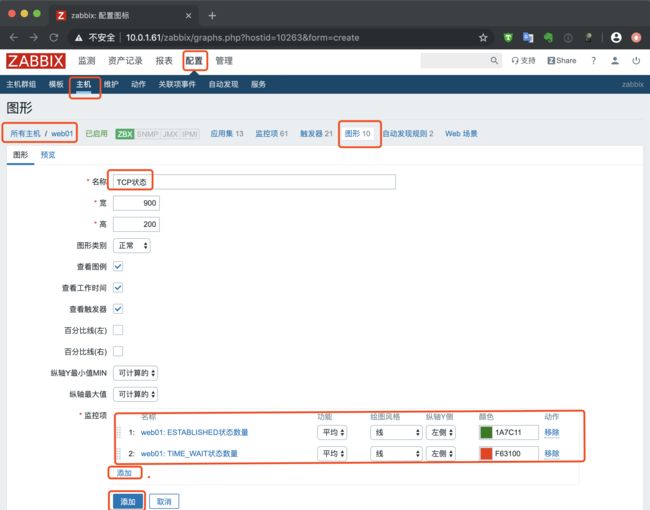
image
8.查看图形

image
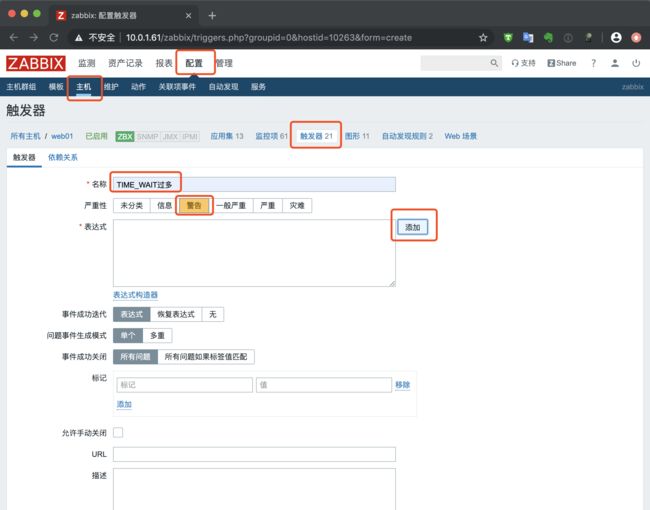
9.设置触发器

image
image

image
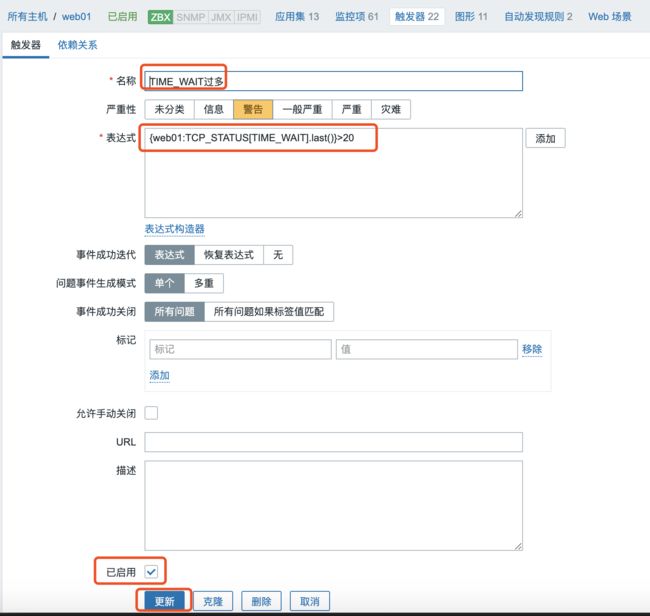
image
第八章 邮件报警
1.定义发件人
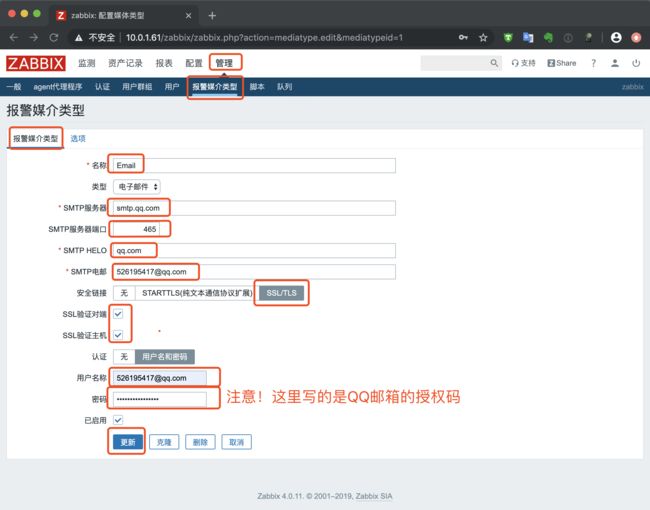
image
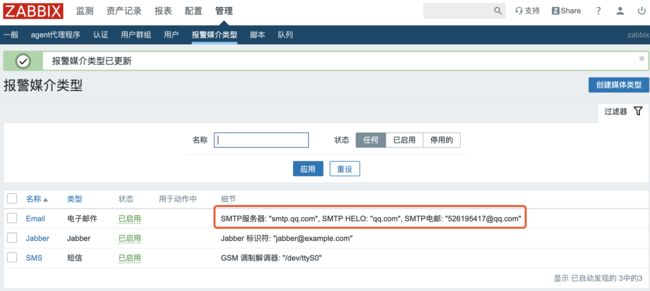
image
2.定义收件人
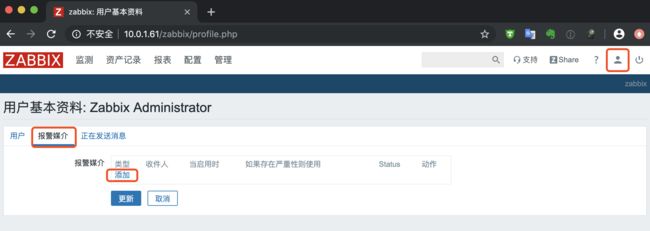
image

image

image
3.自定义报警内容过
定制报警内容:
https://www.zabbix.com/documentation/4.0/zh/manual/appendix/macros/supported_by_location
参考博客
https://www.cnblogs.com/bixiaoyu/p/7302541.html
发送警告
报警邮件标题可以使用默认信息,亦可使用如下中文报警内容名称:Action-Email默认标题:故障{TRIGGER.STATUS},服务器:{HOSTNAME1}发生: {TRIGGER.NAME}故障!告警主机:{HOSTNAME1}告警时间:{EVENT.DATE} {EVENT.TIME}告警等级:{TRIGGER.SEVERITY}告警信息: {TRIGGER.NAME}告警项目:{TRIGGER.KEY1}问题详情:{ITEM.NAME}:{ITEM.VALUE}当前状态:{TRIGGER.STATUS}:{ITEM.VALUE1}事件ID:{EVENT.ID}
恢复警告
恢复标题:恢复{TRIGGER.STATUS}, 服务器:{HOSTNAME1}: {TRIGGER.NAME}已恢复!恢复信息:告警主机:{HOSTNAME1}告警时间:{EVENT.DATE} {EVENT.TIME}告警等级:{TRIGGER.SEVERITY}告警信息: {TRIGGER.NAME}告警项目:{TRIGGER.KEY1}问题详情:{ITEM.NAME}:{ITEM.VALUE}当前状态:{TRIGGER.STATUS}:{ITEM.VALUE1}事件ID:{EVENT.ID}
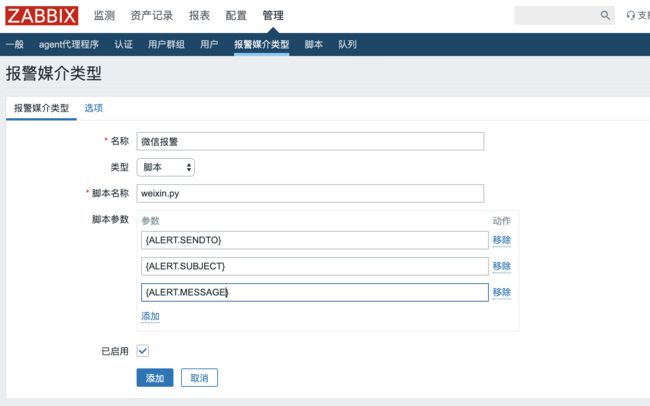
第九章 微信报警
1.查看配置文件里的脚本目录路径
[root@m01~]# grep "^AlertScriptsPath" /etc/zabbix/zabbix_server.confAlertScriptsPath=/usr/lib/zabbix/alertscripts
2.将weixin.py放在zabbix特定目录
[root@m01 /usr/lib/zabbix/alertscripts]# ll总用量 4-rwxr-xr-x 1 root root 1344 8月 7 21:58 weixin.py
3.配置发信人

image
image
4.配置收信人
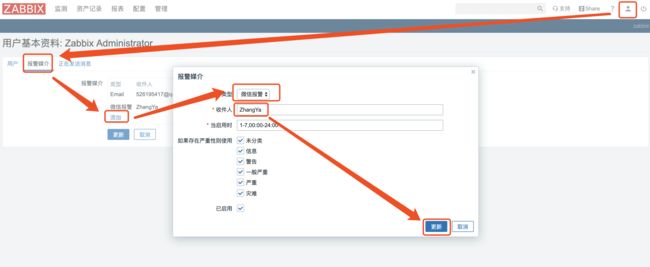
image
5.登陆企业微信公众号添加账户
https://work.weixin.qq.com/wework_admin/loginpage_wx
1.登陆后在企业号上新建应用

image
2.上传logo,填写应用名称 ,应用介绍等

image
3.查看启动应用
同时会生成应用的AgentId以及Secret,这个在后面步骤会有用

image
4.接口调用测试
http://work.weixin.qq.com/api/devtools/devtool.php

image
这里的corpid为公司ID

image
Corpsecret就是刚才创建应用生成的Secrt,确认没问题填写进去然后下一步
如果没问题会显示200状态码

image
6.添加成员

image
7.关注公众号

image
8.查看自己的账号

image
9.修改脚本里的信息
[root@m01/usr/lib/zabbix/alertscripts]# cat weixin.py..............corpid='微信企业号corpid'appsecret='应用的Secret'agentid=应用的id..............
10.发信测试
[root@m01/usr/lib/zabbix/alertscripts]# python weixin.py 你的账号'发信测试'‘微信测试消息’
11.微信号上查看

image
12.发送到整个微信组
虽然我们实现了发送到单个用户的功能,但是如果我们的用户比较多,这样还是麻烦的,不过我们可以发送到整个组,其实脚本里已经预留好了配置,只不过默认注释了。
将脚本修改为以下内容,注释掉用户,打开组设置
#!/usr/bin/env pythonimportrequestsimportsysimportosimportjsonimportlogginglogging.basicConfig(level=logging.DEBUG,format='%(asctime)s, %(filename)s, %(levelname)s, %(message)s',datefmt='%a, %d %b %Y %H:%M:%S',filename=os.path.join('/tmp','weixin.log'),filemode='a')corpid='wwd26fdfb9940e7efa'appsecret='Btg89FnZfMu0k7l6b4iagmAR5Z9TCgKknYbx-SMQvmg'agentid=1000005token_url='https://qyapi.weixin.qq.com/cgi-bin/gettoken?corpid='+corpid+'&corpsecret='+appsecretreq=requests.get(token_url)accesstoken=req.json()['access_token']msgsend_url='https://qyapi.weixin.qq.com/cgi-bin/message/send?access_token='+accesstoken#touser=sys.argv[1]toparty=sys.argv[1]subject=sys.argv[2]message=sys.argv[2]+"\n\n"+sys.argv[3]params={#"touser":touser,"toparty":toparty,"msgtype":"text","agentid":agentid,"text":{"content":message},"safe":0}req=requests.post(msgsend_url,data=json.dumps(params))logging.info('sendto:'+toparty+';;subject:'+subject+';;message:'+message)
12.随机发送到指定用户玩笑脚本
#!/bin/bash num=$(echo $(($RANDOM%28+1)))name=$(sed -n "${num}p" name.txt)ok_boy=$(grep -v "${name}" name.txt)for ok in ${ok_boy}do python weixin.py ${ok} "$1" "$2"done
第十章 自定义模版
1.监控TCP11种状态
编写zabbix配置文件
[root@web01/etc/zabbix/zabbix_agentd.d]# cat zbx_tcp.conf UserParameter=ESTABLISHED,netstat-ant|grep-c'ESTABLISHED'UserParameter=SYN_SENT,netstat-ant|grep-c'SYN_SENT'UserParameter=SYN_RECV,netstat-ant|grep-c'SYN_RECV'UserParameter=FIN_WAIT1,netstat-ant|grep-c'FIN_WAIT1'UserParameter=FIN_WAIT2,netstat-ant|grep-c'FIN_WAIT2'UserParameter=TIME_WAIT,netstat-ant|grep-c'TIME_WAIT'UserParameter=CLOSE,netstat-ant|grep-c'CLOSE'UserParameter=CLOSE_WAIT,netstat-ant|grep-c'CLOSE_WAIT'UserParameter=LAST_ACK,netstat-ant|grep-c'LAST_ACK'UserParameter=LISTEN,netstat-ant|grep-c'LISTEN'UserParameter=CLOSING,netstat-ant|grep-c'CLOSING'
2.重启zabbix-agent
[root@web01~]# systemctl restart zabbix-agent.service
3.测试监控项
使用zabbix-get命令测试
[root@m01 ~]# yum install zabbix-get.x86_64 -y[root@m01 ~]# zabbix_get -s 10.0.1.7 -k ESTABLISHED2[root@m01 ~]# zabbix_get -s 10.0.1.7 -k LISTEN12
3.导入模版文件

image

image
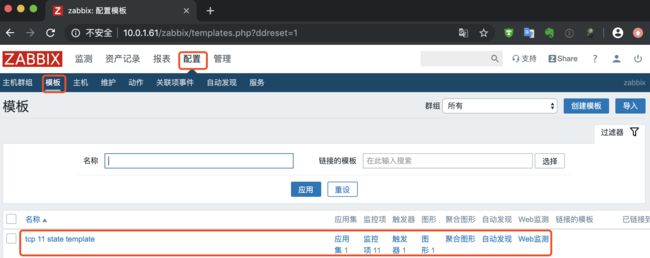
image
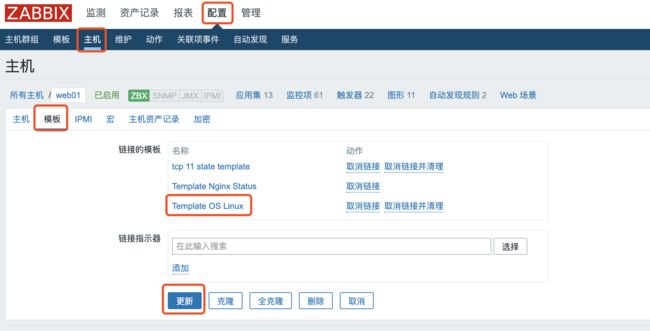
4.主机关联模版文件
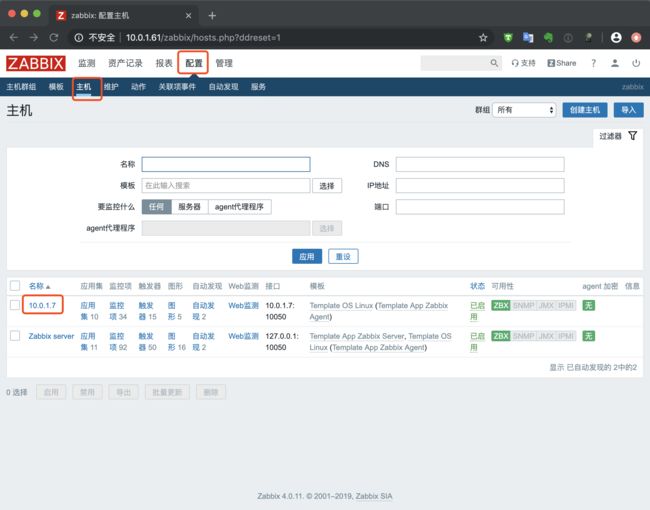
image
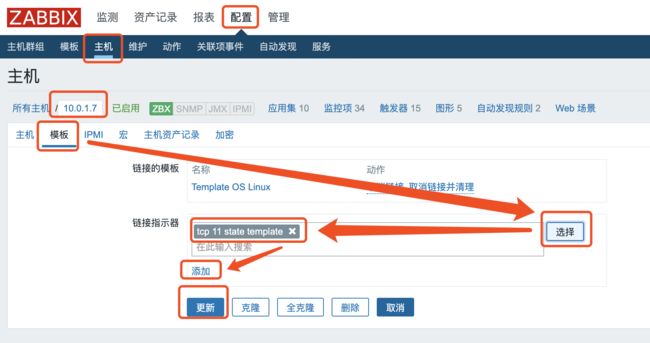
image
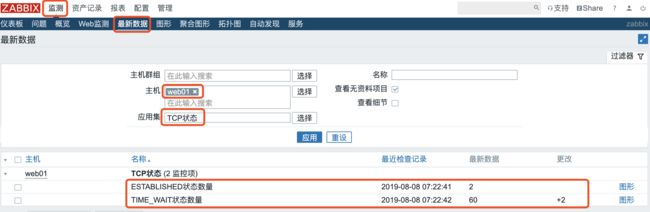
5.查看最新数据
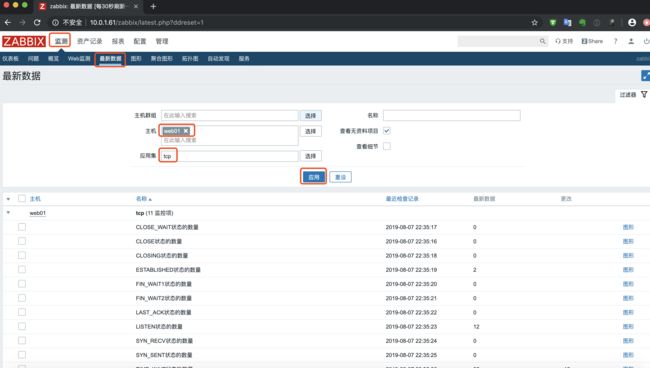
image
6.查看图形
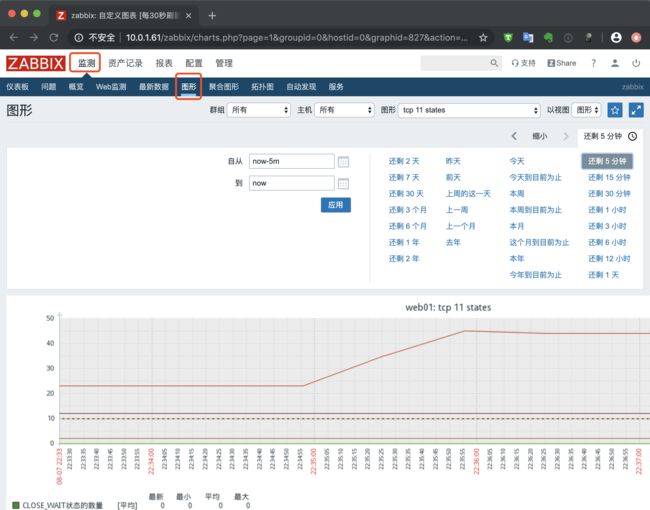
image
第x章 自定义模版监控nginx状态
1.开启监控页面并访问测试
[root@web01~]# cat/etc/nginx/conf.d/status.conf server{listen80;server_name localhost;location/nginx_status{stub_status on;access_log off;}}[root@web01~]# curl127.0.0.1/nginx_status/Activeconnections:1server accepts handled requests666Reading:0Writing:1Waiting:0
2.准备nginx监控状态脚本
[root@web01 /etc/zabbix/zabbix_agentd.d]# cat nginx_monitor.sh #!/bin/bashNGINX_COMMAND=$1CACHEFILE="/tmp/nginx_status.txt"CMD="/usr/bin/curl http://127.0.0.1/nginx_status/"if [ ! -f $CACHEFILE ];then $CMD >$CACHEFILE 2>/dev/nullfi# Check and run the scriptTIMEFLM=`stat -c %Y $CACHEFILE`TIMENOW=`date +%s`if [ `expr $TIMENOW - $TIMEFLM` -gt 60 ]; then rm -f $CACHEFILEfiif [ ! -f $CACHEFILE ];then $CMD >$CACHEFILE 2>/dev/nullfinginx_active(){ grep 'Active' $CACHEFILE| awk '{print $NF}' exit 0;}nginx_reading(){ grep 'Reading' $CACHEFILE| awk '{print $2}' exit 0;}nginx_writing(){ grep 'Writing' $CACHEFILE | awk '{print $4}' exit 0;}nginx_waiting(){ grep 'Waiting' $CACHEFILE| awk '{print $6}' exit 0;}nginx_accepts(){ awk NR==3 $CACHEFILE| awk '{print $1}' exit 0;}nginx_handled(){ awk NR==3 $CACHEFILE| awk '{print $2}' exit 0;}nginx_requests(){ awk NR==3 $CACHEFILE| awk '{print $3}' exit 0;}case $NGINX_COMMAND in active) nginx_active; ;; reading) nginx_reading; ;; writing) nginx_writing; ;; waiting) nginx_waiting; ;; accepts) nginx_accepts; ;; handled) nginx_handled; ;; requests) nginx_requests; ;; *)echo 'Invalid credentials';exit 2;esac
3.编写zabbix监控配置文件
[root@web01~]# cat /etc/zabbix/zabbix_agentd.d/nginx_status.confUserParameter=nginx_status[*],/bin/bash/etc/zabbix/zabbix_agentd.d/nginx_monitor.sh $1[root@web01~]# systemctl restart zabbix-agent.service
4.使用zabbix_get取值
[root@m01 ~]# zabbix_get -s 10.0.1.7 -k nginx_status[accepts]7
5.导入模版

image
6.链接模版
image
7.查看数据

image
第x章 自定义模版监控php状态
1.开启监控页面
[root@web01~]# tail-1/etc/php-fpm.d/www.conf pm.status_path=/php_status[root@web01~]# cat/etc/nginx/conf.d/status.conf server{listen80;server_name localhost;location/nginx_status{stub_status on;access_log off;}location/php_status{fastcgi_pass127.0.0.1:9000;fastcgi_index index.php;fastcgi_paramSCRIPT_FILENAMEhtml$fastcgi_script_name;include fastcgi_params;}}[root@web01~]# nginx-tnginx:the configuration file/etc/nginx/nginx.conf syntaxisoknginx:configuration file/etc/nginx/nginx.conf testissuccessful[root@web01~]# systemctl restart nginx.service php-fpm.service
2.访问测试
[root@web01~]# curl127.0.0.1/php_statuspool:wwwprocess manager:dynamicstart time:08/Aug/2019:22:31:27+0800start since:37accepted conn:1listen queue:0max listen queue:0listen queue len:128idle processes:4active processes:1total processes:5max active processes:1max children reached:0slow requests:0
3.准备访问脚本
[root@web01 ~]# cat /etc/zabbix/zabbix_agentd.d/fpm.sh #!/bin/bash################################### Zabbix monitoring script## php-fpm:# - anything available via FPM status page#################################### Contact:# [email protected]################################### ChangeLog:# 20100922 VV initial creation################################### Zabbix requested parameterZBX_REQ_DATA="$1"ZBX_REQ_DATA_URL="$2"# Nginx defaultsNGINX_STATUS_DEFAULT_URL="http://localhost/fpm/status"WGET_BIN="/usr/bin/wget"## Error handling:# - need to be displayable in Zabbix (avoid NOT_SUPPORTED)# - items need to be of type "float" (allow negative + float)#ERROR_NO_ACCESS_FILE="-0.91"ERROR_NO_ACCESS="-0.92"ERROR_WRONG_PARAM="-0.93"ERROR_DATA="-0.94" # either can not connect / bad host / bad port# Handle host and port if non-defaultif [ ! -z "$ZBX_REQ_DATA_URL" ]; then URL="$ZBX_REQ_DATA_URL"else URL="$NGINX_STATUS_DEFAULT_URL"fi# save the nginx stats in a variable for future parsingNGINX_STATS=$($WGET_BIN -q $URL -O - 2>/dev/null)# error during retrieveif [ $? -ne 0 -o -z "$NGINX_STATS" ]; then echo $ERROR_DATA exit 1fi# # Extract data from nginx stats##RESULT=$(echo "$NGINX_STATS" | awk 'print $0;match($0, "^'"$ZBX_REQ_DATA"':[[:space:]]+(.*)", a) { print a[1] }')#RESULT=$(echo "$NGINX_STATS" | grep "$ZBX_REQ_DATA" | awk -F : '{print $2}')RESULT=$(echo "$NGINX_STATS" | awk -F : "{if(\$1==\"$ZBX_REQ_DATA\") print \$2}")if [ $? -ne 0 -o -z "$RESULT" ]; then echo $ERROR_WRONG_PARAM exit 1fiecho $RESULTexit 0[root@web01 ~]# bash /etc/zabbix/zabbix_agentd.d/fpm.sh "total processes" http://127.0.0.1/php_status5
4.准备zabbix配置文件
[root@web01~]# cat /etc/zabbix/zabbix_agentd.d/fpm.conf UserParameter=php-fpm[*],/etc/zabbix/zabbix_agentd.d/fpm.sh"$1""$2"[root@web01~]# systemctl restart zabbix-agent.service
4.使用zabbix_get取值
[root@m01 ~]# zabbix_get -s 10.0.1.7 -k php-fpm["total processes",http://127.0.0.1/php_status]5
5.导入模版
导入之后需要修改一下模版里的宏配置
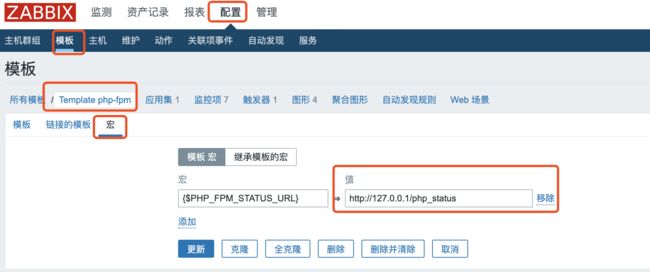
image
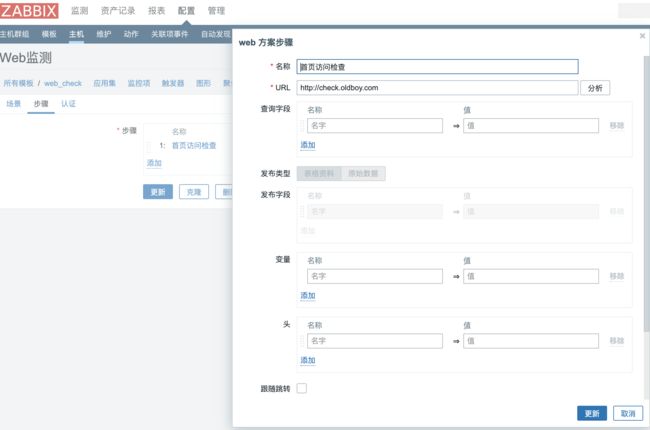
第x章 WEB监控
需求,监控页面状态码

image
image
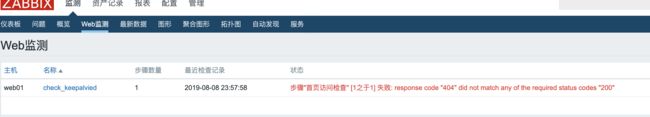
image
第x章 故障记录
故障1
故障现象:
提示zabbix-server is not running
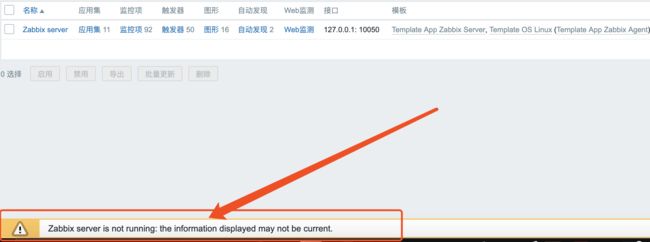
image
报错日志:
34983:20190807:202215.171databaseisdown:reconnectingin10seconds34983:20190807:202225.172[Z3001]connection to database'zabbix'failed:[1045]Accessdeniedforuser'zabbix'@'localhost'(usingpassword:NO)
故障原因:
zabbix-server的配置文件里配有配置数据库密码
故障解决:
添加正确的数据库账号密码信息
[root@m01~]# grep"^DB"/etc/zabbix/zabbix_server.conf DBHost=localhostDBName=zabbixDBUser=zabbixDBPassword=zabbix
故障2
故障现象:微信报警失败
报错日志:
[root@m01~]# tail -f /var/log/zabbix/zabbix_server.log Problemname:TIME_WAIT过多Host:web01Severity:AverageOriginalproblemID:51'":Traceback(most recent call last):File"/usr/lib/zabbix/alertscripts/weixin.py",line7,in
问题原因:
缺少模块 requests
问题解决:
安装缺失的依赖包
[root@m01~]# yum install python-pip[root@m01~]# pip install--upgrade pip[root@m01~]# pip install requests
故障3
故障现象:
在server端使用zabbix_get命令测试键值命令时提示警告
[root@m01 ~]# zabbix_get -s 10.0.1.7 -k ESTABLISHED(Not all processes could be identified,non-owned process info will not be shown,you would have to be root to see it all.)2
问题原因:
zabbix_agent是以普通用户zabbix运行的,而普通用户执行netstat -antp时会有警告,网上查找发现只要不是用p参数就可以以普通用户运行
解决方案:
监控脚本里的命令修改为netstat -ant
作者:我是李小胖
链接:https://www.jianshu.com/p/75281db6bf84
来源:
著作权归作者所有。商业转载请联系作者获得授权,非商业转载请注明出处。