Centos7+Prometheus2.31.1监控Redis6.2.6\Nginx1.20.2\Grafana8.3.3(亲测有效)
1、Nginx1.20.2安装:
# wget http://nginx.org/download/nginx-1.20.2.tar.gz
# yum -y install  gcc gcc-c++ pcre pcre-devel zlib zlib-devel openssl openssl-devel firewalld autoconf automake
# useradd -M -s /sbin/nologin www
# cat /etc/passwd
# cat /etc/group
# tar -zxvf nginx-1.20.2.tar.gz
# cd nginx-1.20.2/
# ./configure --prefix=/usr/local/nginx --user=www --group=www --with-http_ssl_module --with-http_realip_module --with-http_dav_module --with-http_stub_status_module --with-http_addition_module --with-http_sub_module --with-http_flv_module --with-http_mp4_module
# make&&make install编辑nginx服务:vim /etc/systemd/system/nginx.service
[Unit]
Description=The NGINX HTTP and reverse proxy server
After=network.target remote-fs.target nss-lookup.target

[Service]
Type=forking
PIDFile=/usr/local/nginx/logs/nginx.pid
ExecStartPre=/usr/local/nginx/sbin/nginx -t -c /usr/local/nginx/conf/nginx.conf
ExecStart=/usr/local/nginx/sbin/nginx -c /usr/local/nginx/conf/nginx.conf
ExecReload=/usr/local/nginx/sbin/nginx -s reload
ExecStop=/usr/local/nginx/sbin/nginx -s stop
ExecQuit=/usr/local/nginx/sbin/nginx -s quit
PrivateTmp=true

[Install]
WantedBy=multi-user.target
重新加载服务:systemctl daemon-reload
开机启动:systemctl enable nginx.service
启动nginx:/usr/local/nginx/sbin/nginx
平滑重启:/usr/local/nginx/sbin/nginx -s reload
强行停止:/usr/local/nginx/sbin/nginx -s stop
从容停止:/usr/local/nginx/sbin/nginx -s quit
启动:systemctl start nginx
停止:systemctl stop nginx
重启:systemctl reload nginx
查看服务状态:systemctl status nginx
卸载nginx:
# systemctl stop nginx.service
# rm -rf /usr/local/nginx/
# rm -rf /etc/systemd/system/multi-user.target.wants/nginx.service
2、Redis6.2.6安装:
# wget https://download.redis.io/releases/redis-6.2.6.tar.gz
# tar xzf redis-6.2.6.tar.gz -C /usr/local/
# cd /usr/local/
# mv redis-6.2.6/ redis
# cd redis
# make
# make install PREFIX=/usr/local/redis
# make test
如果出现这行英文All tests passed without errors! 证明redis服务已安装完毕。
cp ./redis.conf /usr/local/redis/bin/
修改配置参数:
vim /usr/local/redis/redis.conf
protected-mode no #关闭保护模式
daemonize yes #守护进程模式开启
#bind 127.0.0.1 #注释配置后开启远程访问
并改成自己的IP地址
requirepass 123456 #密码
logfile "/data/redis6/logs/redis.log" #需要设置日志目录
dir /data/redis6/data/ #需要设置数据保存目录
io-threads 1 #需要设置io线程数
开机自动运行:vim /lib/systemd/system/redis.service
[Unit]
Description=Redis
After=network.target

[Service]
Type=forking
ExecStart=/usr/local/redis/bin/redis-server /usr/local/redis/bin/redis.conf
ExecReload=/usr/local/redis/bin/redis-server -s reload
ExecStop=/usr/local/redis/bin/redis-server -s stop
PrivateTmp=true

[Install]
WantedBy=multi-user.target
重新加载服务:systemctl daemon-reload
启动redis服务:systemctl start redis.service
停止redis服务:systemctl stop redis.service
重新启动服务:systemctl restart redis.service
查看服务当前状态:systemctl status redis.service
设置开机自启动:systemctl enable redis.service
停止开机自启动:systemctl disable redis.service
查看端口:ss -anlt
卸载:
find / -name redis
rm -rf 显示的目录
3、Redis监控
1、下载和安装redis_exporter
下载redis_exporter安装包,下载地址:wget https://github.com/oliver006/redis_exporter/releases/download/v1.32.0/redis_exporter-v1.32.0.linux-amd64.tar.gz
tar -zxf redis_exporter-v1.32.0.linux-amd64.tar.gz -C /usr/local/prometheus/P_tools/
cd /usr/local/prometheus/P_tools/
mv redis_exporter-v1.32.0.linux-amd64 /usr/local/prometheus/P_tools/redis_exporter
2、编辑redis_exporter 服务:vim /etc/systemd/system/redis_exporter.service
[Unit]
Description=redis_exporter
Documentation=https://github.com/oliver006/redis_exporter
After=network.target

[Service]
Type=simple
User=root
ExecStart=/usr/local/prometheus/P_tools/redis_exporter/redis_exporter -redis.addr 192.168.159.131:6379  -redis.password 123456
Restart=on-failure

[Install]
WantedBy=multi-user.target
3、创建prometheus用户并授权
# groupadd prometheus
# useradd -g prometheus -m -d /var/lib/prometheus -s /sbin/nologin prometheus
# chown -R prometheus:prometheus /usr/local/prometheus/P_tools/redis_exporter
重新载入配置文件:systemctl daemon-reload
开机启动:systemctl enable redis_exporter
开启服务:systemctl start redis_exporter
查看服务状态:systemctl status redis_exporter
查看端口:ss -tln | grep 9121
4、编辑 prometheus.yml
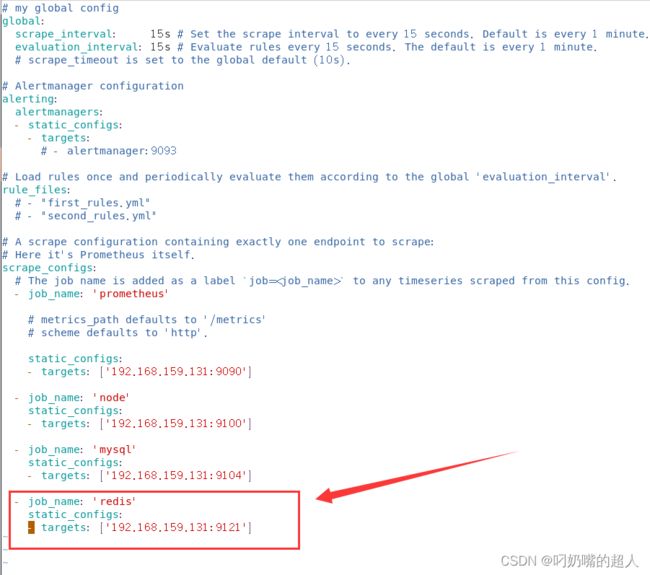
重启prometheus:systemctl restart prometheus
现在进入https://grafana.com/grafana/dashboards/网站去搜索Redis的json模板文件,我这里下载的是Redis Dashboard for Prometheus Redis Exporter
把刚才下载的json模板文件在Grafana平台里点击左侧菜单的Import导入按钮进行导入,也可以直接输入下载json模板文件的ID编号后点击load进行读取
成功导入json模板文件后,监控的各项模块相继的就展示出来了。(如果数据没出来,稍微等一会儿就好了,下面是所展示的监控数据。)

4、Nginx监控
下载安装nginx-module-vts
# wget https://github.com/vozlt/nginx-module-vts/archive/v0.1.18.tar.gz
# tar xzf v0.1.18.tar.gz -C /usr/local/prometheus/P_tools/
# cd /usr/local/prometheus/P_tools/
# mv nginx-module-vts-0.1.18 /usr/local/prometheus/P_tools/nginx-module-vts
# cd /root/下载/nginx-1.20.2/
重新配置Nginx
# ./configure --prefix=/usr/local/nginx --user=www --group=www  --with-http_ssl_module --with-http_realip_module  --with-http_dav_module --with-http_stub_status_module --with-http_addition_module --with-http_sub_module --with-http_flv_module --with-http_mp4_module --add-module=/usr/local/prometheus/P_tools/nginx-module-vts/
# make && make install
# cd /usr/local/nginx/conf
备份nginx.conf文件:cp nginx.conf nginx.conf.bak
编辑并插入以下代码,在http中插入
vim nginx.conf
vhost_traffic_status_zone;
server {
	listen 81;
	location /status {
		vhost_traffic_status_display;
        vhost_traffic_status_display_format html;
	}
}
软连接设置:ln -s /usr/local/nginx/sbin/nginx /usr/local/bin
检查文件正确性:nginx -t
重启系统:reboot
查看进程:ps -ef |grep nginx

查看端口:ss -lntp |grep nginx

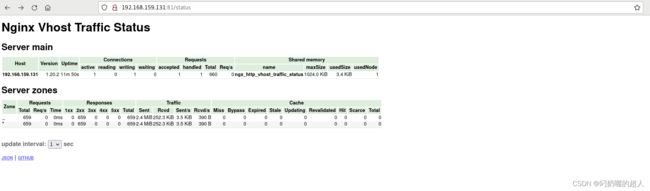
如出现81端口证明安装成功。
在浏览器输入ip地址:81/status,如能正常显示证明安装成功。
下载安装nginx-vts-exporter
进入https://github.com/hnlq715/nginx-vts-exporter/releases/tag/v0.10.3进行下载
tar xzf nginx-vts-exporter-0.10.3.linux-amd64.tar.gz -C /usr/local/prometheus/P_tools/
cd /usr/local/prometheus/P_tools/
mv nginx-vts-exporter-0.10.3.linux-amd64 /usr/local/prometheus/P_tools/nginx-vts-exporter
cd nginx-vts-exporter/
运行:./nginx-vts-exporter -nginx.scrape_timeout 10 -nginx.scrape_uri http://192.168.159.131:81/status/format/json
打开新命令窗口查看端口9913,如果出现9913端口视为启动成功。:ss -lntp |grep 9913
编辑nginx-vts-exporter服务:vim /usr/lib/systemd/system/nginx_vts_exporter.service
vim /usr/lib/systemd/system/nginx_vts_exporter.service
[Unit]
Description=prometheus_nginx_vts
After=network.target

[Service]
Type=simple
ExecStart=/usr/local/prometheus/P_tools/nginx-vts-exporter/./nginx-vts-exporter -nginx.scrape_timeout 10 -nginx.scrape_uri http://192.168.159.131:81/status/format/json
Restart=on-failure

[Install]
WantedBy=multi-user.target
重新载入配置文件:systemctl daemon-reload
开机自动启动:systemctl enable nginx_vts_exporter
开启服务:systemctl start nginx_vts_exporter
查看状态:systemctl status nginx_vts_exporter
跳转到prometheus目录进行编辑,把nginx添加到监控里
cd /usr/local/prometheus
vim ./prometheus.yml
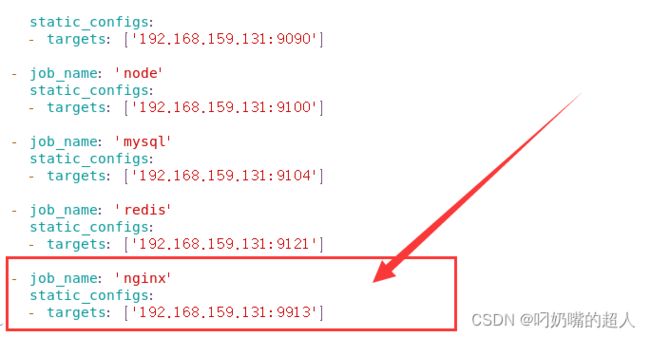
重启prometheus:systemctl restart prometheus.service
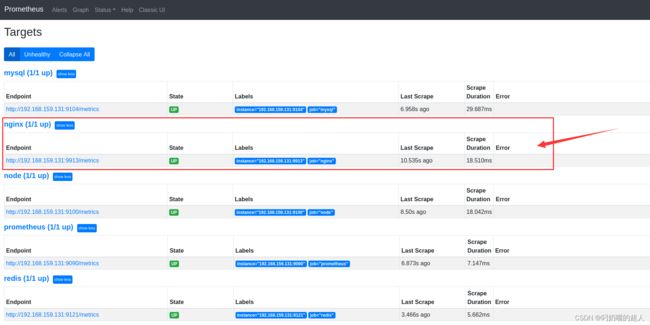
返回Prometheus浏览器页面查看状态
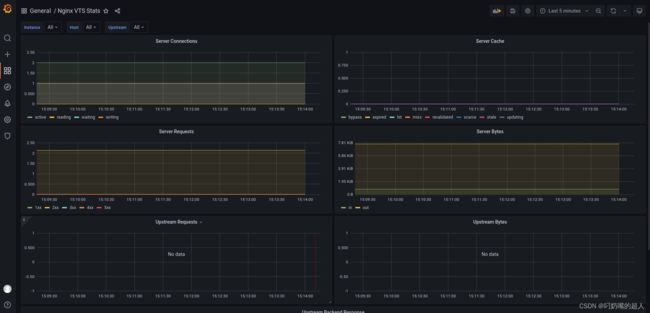
Grafana平台里点击左侧菜单的Import导入按钮进行导入在Import via grafana.com下面的文本框输入2949,然后点击Load进行导入后Grafana平台会自动跳转到监控页面。下面的截图就是监控到nginx的各项信息。(注:也可进入dashboards模板地址https://grafana.com/dashboards,进入后直接搜索您想使用的json模板进行下载。)
以上是针对Centos7 上部署监控Redis6.2.6\Nginx1.20.2的整体详细过程。如有问题可以在评论区与我联系。