graphviz linux 运行,绘图工具Graphviz学习使用
起因
最近完成了研究生毕业设计,在写毕业论文时,老师曾经推荐使用代码来画相关的图,当时时间有些紧,所以没有这样做。最近在看 rapidjson 的文档,看到 miloyip 文档中的图都是用 dot 文件的源代码编译出来的,一查,原来是 graphviz 的源代码。遂用了半天简单学习了下 graphviz 的语法和使用,感觉很不错,以后画图有了一个不错的工具。
graphviz 是一个运用广泛的命令行绘图软体,不过说是绘图软体,它能绘的图并不是一般人想像中的漫画或logo,而是数学意义上的 graph ,比较通俗的说法就是「关系图」。
安装
graphviz 支持 Windows、Mac OS X、FreeBSD、Solaris、Linux 等多种系统
Ubuntu或Debian下安装很简单:
sudo apt-get install graphviz
Mac下使用 brew
brew install graphviz
入门使用
1. 编写以 dot 为后缀的源代码文件,如:
// hello.dot digraph {
hello -> world;
}
2. 使用 dot 命令编译,如
dot hello.dot -T png -o hello.png
完整的命令为:
<cmd> <inputfile> -T <format> -o <outputfile>
其中graphviz 的 <cmd> 有好几种,每种使用方法都完全相同,差别只在于渲染出来的图片效果不一样。 man 中的简介是这样的:
介绍
dot
渲染的图具有明确方向性。
neato
渲染的图缺乏方向性。
twopi
渲染的图采用放射性布局。
circo
渲染的图采用环型布局。
fdp
渲染的图缺乏方向性。
sfdp
渲染大型的图,图片缺乏方向性。
可以透过 man <cmd> 取得进一步说明。但还是亲自用用比较容易理解。在本文中,凡没有说明的图,预设都是以 dot 渲染出来的。
3. 查看效果
效果如下:

语法介绍
graphviz使用dot语法来说明,其它语法可以用形式化的描述如下:
graph = [strict] (digraph | graph) id ’{’ stmt-list ’}’
stmt-list = [stmt [’;’] [stmt-list ] ]
stmt = attr-stmt | node-stmt | edge-stmt | subgraph | id ’=’ id
attr-stmt = (graph | node | edge) attr-list
attr-list = ’[’ [a-list ] ’]’ [attr-list]
a-list = id ’=’ id [’,’] [a-list]
node-stmt = node-id [attr-list]
node-id = id [port]
port = port-location [port-angle] | port-angle [port-location]
port-location = ’:’ id|’:’ ’(’id’,’id’)’
port-angle = ’@’ id
edge-stmt = (node-id | subgraph) edgeRHS [attr-list]
edgeRHS = edgeop (node-id | subgraph) [edgeRHS]
subgraph = [subgraph id] ’{’ stmt-list ’}’ | subgraph id
graphviz 有两种图,一种是无向图 graph ,边用 -- 连接,一种是有向图 digraph ,边用 -> 连接,这个可以很简单的实践。
具体的图说明内容包含属性(attr)、节点(node)、边(edge)和子图(subgraph)说明。
节点属性如下 :
NameDefaultValues
color
black
node shape color
comment
any string (format-dependent)
distortion
0.0
node distortion for shape=polygon
fillcolor
lightgrey/black
node fill color
fixedsize
false
label text has no affect on node size
fontcolor
black
type face color
fontname
Times-Roman
font family
fontsize
14
point size of label
group
name of node’s group
height
.5
height in inches
label
node name
any string
layer
overlay range
all, id or id:id
orientation
0.0
node rotation angle
peripheries
shape-dependent
number of node boundaries
regular
false
force polygon to be regular
shape
ellipse
node shape; see Section 2.1 and Appendix E
shapefile
external EPSF or SVG custom shape file
sides
4
number of sides for shape=polygon
skew
0.0
skewing of node for shape=polygon
style
graphics options, e.g. bold, dotted, filled; cf. Section 2.3
URL
URL associated with node (format-dependent)
width
.75
width in inches
z
0.0
z coordinate for VRML output
边属性如下:
NameDefaultValues
arrowhead
normal
style of arrowhead at head end
arrowsize
1.0
scaling factor for arrowheads
arrowtail
normal
style of arrowhead at tail end
color
black
edge stroke color
comment
any string (format-dependent)
constraint
true
use edge to affect node ranking
decorate
if set, draws a line connecting labels with their edges
dir
forward
forward, back, both, or none
fontcolor
black
type face color
fontname
Times-Roman
font family
fontsize
14
point size of label
headlabel
label placed near head of edge
headport
n,ne,e,se,s,sw,w,nw
headURL
URL attached to head label if output format is ismap
label
edge label
labelangle
-25.0
angle in degrees which head or tail label is rotated off edge
labeldistance
1.0
scaling factor for distance of head or tail label from node
labelfloat
false
lessen constraints on edge label placement
labelfontcolor
black
type face color for head and tail labels
labelfontname
Times-Roman
font family for head and tail labels
labelfontsize
14
point size for head and tail labels
layer
overlay range
all, id or id:id
lhead
name of cluster to use as head of edge
ltail
name of cluster to use as tail of edge
minlen
1
minimum rank distance between head and tail
samehead
tag for head node; edge heads with the same tag are
sametail
merged onto the same port
style
tag for tail node; edge tails with the same tag are merged onto the same port
taillabel
graphics options, e.g. bold, dotted, filled; cf. Section 2.3
tailport
label placed near tail of edge n,ne,e,se,s,sw,w,nw
tailURL
URL attached to tail label if output format is ismap
weight
1
integer cost of stretching an edge
图属性如下:
NameDefaultValues
bgcolor
background color for drawing, plus initial fill color
center
false
center drawing on page
clusterrank
local
may be global or none
color
black
for clusters, outline color, and fill color if fillcolor not defined
comment
any string (format-dependent)
compound
false
allow edges between clusters
concentrate
false
enables edge concentrators
fillcolor
black
cluster fill color
fontcolor
black
type face color
fontname
Times-Roman
font family
fontpath
list of directories to search for fonts
fontsize
14
point size of label
label
any string
labeljust
centered
”l” and ”r” for left- and right-justified cluster labels, respectively
labelloc
top
”t” and ”b” for top- and bottom-justified cluster labels, respectively
layers
id:id:id…
margin
.5
margin included in page, inches
mclimit
1.0
scale factor for mincross iterations
nodesep
.25
separation between nodes, in inches.
nslimit
if set to f, bounds network simplex iterations by (f)(number of nodes) when setting x-coordinates
nslimit1
if set to f, bounds network simplex iterations by (f)(number of nodes) when ranking nodes
ordering
if out out edge order is preserved
orientation
portrait
if rotate is not used and the value is landscape, use landscape orientation
page
unit of pagination, e.g. “8.5,11”
pagedir
BL
traversal order of pages
quantum
if quantum ¿ 0.0, node label dimensions will be rounded to integral multiples of quantum
rank
same, min, max, source or sink
rankdir
TB
LR (left to right) or TB (top to bottom)
ranksep
.75
separation between ranks, in inches.
ratio
approximate aspect ratio desired, fill or auto
remincross
if true and there are multiple clusters, re-run crossing minimization
rotate
If 90, set orientation to landscape
samplepoints
8
number of points used to represent ellipses and circles on output (cf. Appendix C
searchsize
30
maximum edges with negative cut values to check when looking for a minimum one during network simplex
size
maximum drawing size, in inches
style
graphics options, e.g. filled for clusters
URL
URL associated with graph (format-dependent)
实例
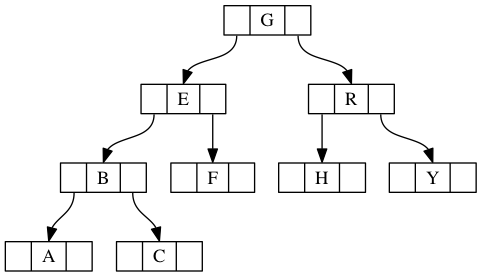
介绍了上面的语法,实际使用的时候就是学习几个详细的例子,下面是一个二叉树代码:
digraph g {
node [shape = record,height=.1];
node0[label = " | G| "];
node1[label = " | E| "];
node2[label = " | B| "];
node3[label = " | F| "];
node4[label = " | R| "];
node5[label = " | H| "];
node6[label = " | Y| "];
node7[label = " | A| "];
node8[label = " | C| "];
"node0":f2 -> "node4":f1;
"node0":f0 -> "node1":f1;
"node1":f0 -> "node2":f1;
"node1":f2 -> "node3":f1;
"node2":f2 -> "node8":f1;
"node2":f0 -> "node7":f1;
"node4":f2 -> "node6":f1;
"node4":f0 -> "node5":f1;
}
效果如下:
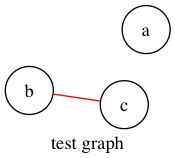
python调用
除了可以使用 dot 文件编写图形外,也可以使用python编写相关的代码,生成图形文件,
安装方法:
pip install pygraphviz
引用 PyGraphviz :
import pygraphviz as pgv
初始化图类:
G=pgv.AGraph()
增加结点和边:
G.add_node('a') # adds node 'a'
G.add_edge('b','c') # adds edge 'b'-'c' (and also nodes 'b', 'c')
设置属性:
G.graph_attr['label']='test graphf'
G.node_attr['shape']='circle'
G.edge_attr['color']='red'
设置输出的格式:
G.layout() # default to neato
G.layout(prog='dot') # use do
输出到文件:
G.draw('file.png') # write previously positioned graph to PNG file
G.draw('file.ps',prog='circo') # use circo to position, write PS file
效果:
参考
