Python——使用matplotlib进行多图合并、局部放大及住次坐标轴绘制方法
本文总结了使用matplotlib绘制多个图片分格显示绘制方法,图中图(即:局部放大图)绘制方法以及次坐标轴绘制方法。
多图合并绘制
- 1. Subplot多图合一显示
- 2. 图中图
- 3. 次坐标轴
1. Subplot多图合一显示
## method 1:subplot
plt.figure()
plt.subplot(2,2,1)
plt.plot([0,1],[0,1])

plt.subplot(2,2,2)
plt.plot([0,1],[0,2])

plt.subplot(2,2,3)
plt.plot([0,1],[0,3])

plt.subplot(2,2,4)
plt.plot([0,1],[0,4])

plt.tight_layout()  #检查坐标轴标签、刻度标签以及标题的部分。自动调整子图参数,使之填充整个图像区域。
plt.show()
## method 2:subplots
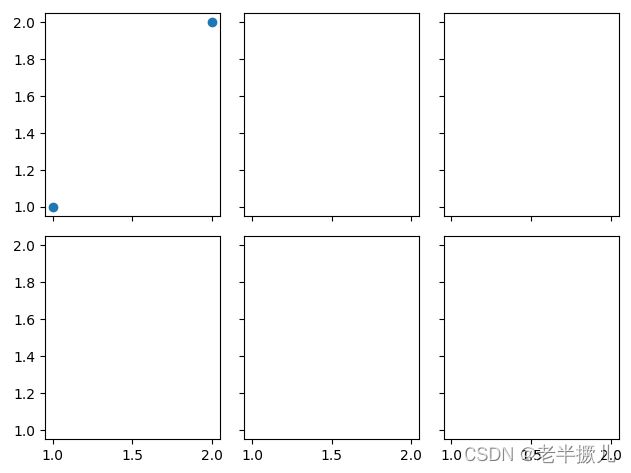
f,((ax11,ax12,ax13),(ax21,ax22,ax23)) = plt.subplots(2,3,sharex=True,sharey=True)
ax11.scatter([1,2],[1,2])
plt.tight_layout()  #检查坐标轴标签、刻度标签以及标题的部分。自动调整子图参数,使之填充整个图像区域。
plt.show()
## method 3:subplot2grid
plt.figure()
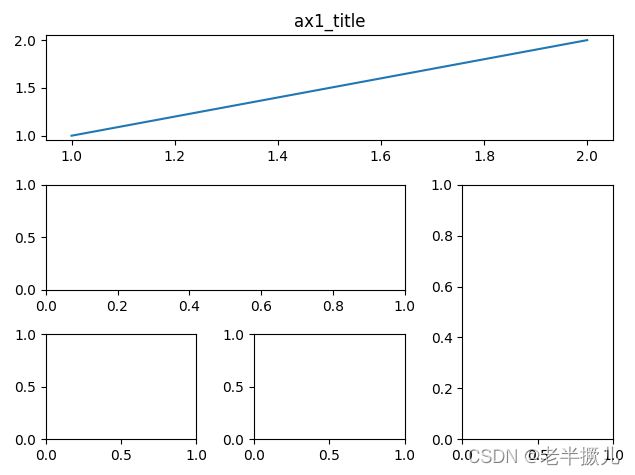
ax1 = plt.subplot2grid((3,3),(0,0),colspan=3,rowspan=1)
ax1.plot([1,2],[1,2])
ax1.set_title('ax1_title')
ax2 = plt.subplot2grid((3,3),(1,0),colspan=2,rowspan=1)
ax3 = plt.subplot2grid((3,3),(1,2),colspan=1,rowspan=2)
ax4 = plt.subplot2grid((3,3),(2,0),colspan=1,rowspan=1)
ax5 = plt.subplot2grid((3,3),(2,1),colspan=1,rowspan=1)
plt.tight_layout()  #检查坐标轴标签、刻度标签以及标题的部分。自动调整子图参数,使之填充整个图像区域。
plt.show()
## method 4:gridspec
plt.figure()
gs = gridspec.GridSpec(3,3)
ax1 = plt.subplot(gs[0,:])
ax2 = plt.subplot(gs[1,:2])
ax3 = plt.subplot(gs[1:,2])
ax4 = plt.subplot(gs[-1,0])
ax5 = plt.subplot(gs[-1,-2])
plt.tight_layout()  #检查坐标轴标签、刻度标签以及标题的部分。自动调整子图参数,使之填充整个图像区域。
plt.show()
2. 图中图
fig = plt.figure()
x = [1,2,3,4,5,6,7]
y = [1,3,4,2,5,8,6]

left,bottom,width,height = 0.1,0.1,0.8,0.8
ax1 = fig.add_axes([left,bottom,width,height])
ax1.plot(x,y,'r')
ax1.set_xlabel('x')
ax1.set_ylabel('y')
ax1.set_title('title')

left,bottom,width,height = 0.2,0.6,0.25,0.25
ax2 = fig.add_axes([left,bottom,width,height])
ax2.plot(y,x,'r')
ax2.set_xlabel('b')
ax2.set_ylabel('y')
ax2.set_title('title inside 1')

left,bottom,width,height = 0.6,0.2,0.25,0.25
ax3 = fig.add_axes([left,bottom,width,height])
ax3.plot(y[::-1],x,'g')
ax3.set_xlabel('x')
ax3.set_ylabel('y')
ax3.set_title('title inside 2')

plt.show()
3. 次坐标轴
x = np.arange(0,10,0.1)
y1 = 0.05*x**2
y2 = -1*y1

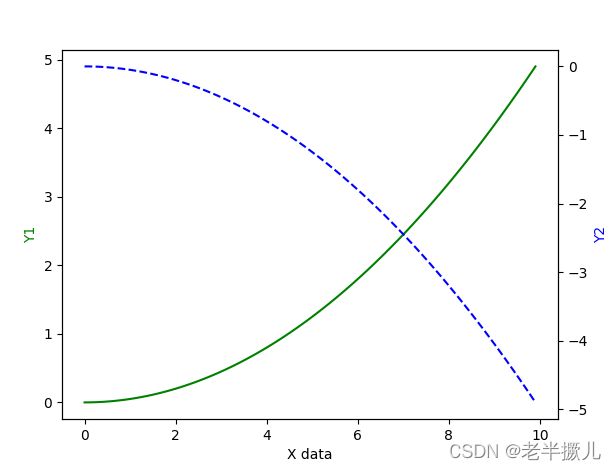
fig,ax1 = plt.subplots()
ax2 = ax1.twinx()
ax1.plot(x,y1,'g-')
ax2.plot(x,y2,'b--')

ax1.set_xlabel('X data')
ax1.set_ylabel('Y1',color='g')
ax2.set_ylabel('Y2',color='b')


