OpenCV-Python——第17.2章:图像轮廓特征
目录
1 图像的矩 2 轮廓面积 3 轮廓周长 4 轮廓近似
1 图像的矩
图像的矩可以帮助我们计算图像的质心,面积等。
函数 cv2.moments() 会将计算得到的矩以一个字典的形式返回。
cv2.moments(array, binaryImage)
- array:输入数组或光栅图像,常用contours[0]
- binaryImage:默认值是false,如果为true,则所有非零的像素都会按值1对待,阈值为1,此参数仅对图像有效。
可以利用矩计算对象重心:
import cv2
import numpy as np

img = cv2.imread('star.jpg',0)
ret,thresh = cv2.threshold(img,127,255,0)
image, contours, hierarchy = cv2.findContours(thresh, cv2.RETR_TREE, cv2.CHAIN_APPROX_SIMPLE)

cnt = contours[0]
M = cv2.moments(cnt)  # 矩

# 重心
cx = int(M['m10']/M['m00'])
cy = int(M['m01']/M['m00'])
2 轮廓面积
cv2.contourArea(contour, oriented)
- contour: 输入数组,常用contours[0]
- oriented: 有默认值false,面向区域标识符,如果为true,该函数返回一个带符号的面积,其正负取决于轮廓的方向(顺时针还是逆时针)。根据这个特性可以根据面积的符号来确定轮廓的位置。如果是默认值false,则面积以绝对值的形式返回.
3 轮廓周长
用于计算封闭轮廓的周长或曲线的长度
cv2.arcLength(curve, closed)
- curve:轮廓,常用contours[0]
- closed:用来指定对象的形状是闭合的(True),还是打开的(一条曲线)。
举个例子:
import cv2
import numpy as np
from matplotlib import pyplot as plt

src = cv2.imread('test21_2.jpg')
img = src.copy()
imgray = cv2.cvtColor(img, cv2.COLOR_BGR2GRAY)
ret, thresh = cv2.threshold(imgray, 127, 255, 0)
image, contours, hierarchy = cv2.findContours(thresh, cv2.RETR_TREE, cv2.CHAIN_APPROX_SIMPLE)
cnt = contours[0]
length = cv2.arcLength(cnt, True)

epsilon = 0.08*length
approx = cv2.approxPolyDP(cnt, epsilon, True)
M = cv2.moments(approx)
area = cv2.contourArea(approx)
length1 = cv2.arcLength(approx, True)

cv2.drawContours(img, approx, -1, (0, 255, 0), 3)
cv2.polylines(img, [approx], True, (0, 255, 0), 3)

font = cv2.FONT_HERSHEY_SIMPLEX  # 设置字体样式
text = 'Area:  '+str(int(area))+'  Length:  '+str(int(length1))
cv2.putText(img, text, (10, 30), font, 0.5, (0, 255, 0), 1, cv2.LINE_AA, 0)

plt.subplot(121), plt.imshow(cv2.cvtColor(src, cv2.COLOR_BGR2RGB)), plt.title('Src')
plt.subplot(122), plt.imshow(cv2.cvtColor(img, cv2.COLOR_BGR2RGB)), plt.title('image')
plt.show()
结果如下:
4 轮廓近似
将轮廓形状近似到另外一种由更少点组成的轮廓形状,新轮廓的点的数目 由我们设定的准确度来决定。使用的Douglas-Peucker算法,你可以到维基百 科获得更多此算法的细节。
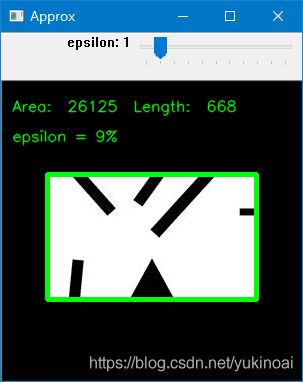
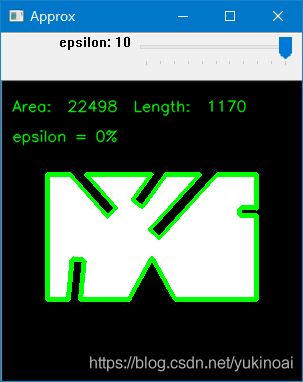
为了帮助理解,假设我们要在一幅图像中查找一个矩形,但是由于图像的种种原因,我们不能得到一个完美的矩形,而是一个“坏形状”(如下图所示)。 现在你就可以使用这个函数来近似这个形状了。这个函数的第二个参数叫 epsilon,它是从原始轮廓到近似轮廓的最大距离。它是一个准确度参数。选 择一个好的 epsilon 对于得到满意结果非常重要。
cv2.approxPolyDP(curve, epsilon, closed, approxCurve)
- curve: 一般是由图像的轮廓点组成的点集
- approxCurve:表示输出的多边形点集
- epsilon:表示输出的精度,就是另个轮廓点之间最大距离数,5,6,7,,8,,,,,
- closed:表示输出的多边形是否封闭
举个例子来说明epsilon的重要:
import cv2
import numpy as np
from matplotlib import pyplot as plt


def nothing(x):  # 滑动条的回调函数
    pass


src = cv2.imread('test21_2.jpg')  # 图片1
imgray = cv2.cvtColor(src, cv2.COLOR_BGR2GRAY)
ret, thresh = cv2.threshold(imgray, 127, 255, 0)
WindowName = 'Approx'  # 窗口名
cv2.namedWindow(WindowName, cv2.WINDOW_AUTOSIZE)  # 建立空窗口

cv2.createTrackbar('epsilon', WindowName, 0, 10, nothing)  # 创建滑动条


while(1):
    img = src.copy()
    n = 10 - cv2.getTrackbarPos('epsilon', WindowName)  # 获取滑动条值

    image, contours, hierarchy = cv2.findContours(thresh, cv2.RETR_TREE, cv2.CHAIN_APPROX_SIMPLE)
    cnt = contours[0]
    length = cv2.arcLength(cnt, True)

    epsilon = (n/100)*length
    approx = cv2.approxPolyDP(cnt, epsilon, True)
    M = cv2.moments(approx)
    area = cv2.contourArea(approx)
    length1 = cv2.arcLength(approx, True)

    cv2.drawContours(img, approx, -1, (0, 255, 0), 3)
    cv2.polylines(img, [approx], True, (0, 255, 0), 3)

    font = cv2.FONT_HERSHEY_SIMPLEX  # 设置字体样式
    text1 = 'Area:  '+str(int(area))+'  Length:  '+str(int(length1))
    text2 = 'epsilon = ' + str(n) + '%'
    cv2.putText(img, text1, (10, 30), font, 0.5, (0, 255, 0), 1, cv2.LINE_AA, 0)
    cv2.putText(img, text2, (10, 60), font, 0.5, (0, 255, 0), 1, cv2.LINE_AA, 0)

    cv2.imshow(WindowName, img)
    k = cv2.waitKey(1) & 0xFF
    if k == 27:
        break
cv2.destroyAllWindows()
epsilon值从大到小的结果依次为:


