DBSCAN 聚类 Matlab 可视化 实现
机器学习算法之:DBSCAN 聚类 MATLAB 可视化实现
DBSCAN介绍
DBSCAN( Density-Based Spatial Clustering of Applications with Noise ) 是一种比较有代表性的基于密度的聚类(Density-based clustering)模型,即通过样本分布的紧密程度来对样本进行分类。
- 一些术语
簇: 在DBSCAN中,将簇描述为密度相连的最大点集,即通过样本密度,将相对紧密的点集划分成为一个簇。
E-邻域: 所谓E-邻域,就是对于样本点周围以E为半径的区域。
核心点: 稠密区域内部的点,在该点半径为E的区域,样本点超过MinPts的点。
边界点: 稠密区域边界上的点,在该点E-邻域内,样本点小于MinPts的点,但该点为核心点的邻居。
噪声点: 稀疏区域中的点,除上面的点外的点。
直接密度可达: 如果p为q的E-邻域内,且q为一个核心点,
密度可达: 对于一串样本点满足p = p1 – p2 – p3 – … – pn = q (–代表直接密度可达) ,则称p与q密度可达。(相当于同一条链路的两个样本点)
密度相连: 如果关于样本O为 p, q 关于E-邻域以及MinPts的密度可达,则称p与q是密度相连的。(相当于分叉链路中处于交点周围点的关系)
-算法思路
伪代码:
标记所有样本点为unvisited;
while(随机选择一个unvisited样本点m,直到没有unvisited样本点)
{
   m = visited;
   if(m的E-邻域的样本点个数>=MinPts)
   {
      创建新簇Sm,并将m添加到Sm;
      将m的E-邻域样本点放入集合N中;
      for(每个样本n in N)
      {
         if(n==unvisited)
         {
            n = visited;
            if(n的E-邻域的样本点个数 >= MinPts)
               将这些对象添加到N中;
            if(n不是任何簇的成员)
               将n添加到N;
         }
       }
       输出Sm;
    }
    else
       标记m为噪声;
}
DBSCAN动态MATLAB展示
下面是DBSCAN的动态演示Matlab代码
%% DBSCAN: A kind of density-based clustering algorithm
%  INPUT: D: A data set contains n objects. ?: Radius. M: Density threshold for neighborhood
%  Reference: wenku.baidu.com/view/e823e12ee2bd960590c677d6.html
function DBSCAN
% Clear variables, etc..
clear;
close all;
clc;
%%
% Initialize data sets ( data1 data2 data3 )
n = 200;                                        % The first and second data sets
a = linspace(0,8*pi,n/2);                       % Set the values for x
%u = [1.2*a.*cos(a) 1.2*(a+pi).*cos(a)]'+0.1*rand(n,1);
%v = [1.2*a.*sin(a) 1.2*(a+pi).*sin(a)]'+0.1*rand(n,1);
u = [5*cos(a)+5 10*cos(a)+5]'+1*rand(n,1);
v = [5*sin(a)+5 10*sin(a)+5]'+1*rand(n,1);
% The third data set - Gaussian distribution
mu1 = [20 20];                                  % The first data set
S1 = [2 0;0 2];                                 % Co-variance matrix
data1 = mvnrnd(mu1,S1,100);                     % Generate the gaussian distribution data set 3

data = [u v;data1];                             % Combine these three data sets together
%figure(1);                                      % Draw these data in figure1
%plot(data(1:100,1),data(1:100,2),'b*');         % The first data set
%hold on
%plot(data(101:200,1),data(101:200,2),'r*');     % The second data set
%plot(data(201:300,1),data(201:300,2),'g*');     % The third data set
%hold off

image = imread('1.png');
disp(image);
[x,y]=find(image == 1);
data=[x,y];


dbscan(data,3,0.2);                % random_data
%dbscan(data,3,0.004);              % 2.png
%dbscan(data,3,0.2);                % 1.png
%dbscan(data,3,0.02);                % 1.png
end

%% DBSCAN function parameters
% Input: data (m,n), m objects n variables
% k number of objects in a neighborhood of an object
% (minimum number of object in a neighborhood of an object)
% Eps - neighborhood radius
% Output: class - vector specifying assignment of the i-th object
% type - vector specifying type of the i-th object
% (core:1, border:0, outlier:-1)
% Reference: http://www.chemometria.us.edu.pl

function [class,type,clusteridx]=dbscan(data,k,Eps)

    x=zscore(data); % Standarlize
    [m,~] = size(data);
    if nargin<3||isempty(Eps)
        [Eps]=epsilon(x,k);
    end
    x=[(1:m)',x];               % Add the serial number
    [m,n] = size(x);            % Reobtain the row and column
    type = zeros(1,m);          % Initialize the type values
    no = 1;                     % The serial number of current cluster
    touched = zeros(m,1);       % whether this object is scanned
    class = zeros(1,m)-2;
    % Draw the initial scaled data set
    figure(2);
    plot(x(:,2),x(:,3),'k.');
    xlabel('x');ylabel('y');
    title('Predict data by using DBSCAN');
    hold on;
    color1 = [rand(),rand(),rand()];
    color2 = [rand(),rand(),rand()];
    for i = 1:m                             % Traverse the whole data set
        if touched(i) == 0                  % if this object is not scaned
            ob = x(i,:);                    % Obtain the current object
            %D=dist(ob(2:n), x(:,2:n));      % Calculate the Euclidean distance
            %ind = find(D <= Eps);           % Obtain the number of neighbor
            ind=kdtree(x(:,2:n),ob(2:n),Eps);
            if(length(ind) > 1 && length(ind) < k+1);   % Border point
                type(i) = 0;                            % Border point: 0
                class(i) = 0;
            end
            if(length(ind)==1)                  % Outlier point
                type(i) = -1;                   % Outlier point: -1
                class(i) = -1;
                touched(i)=1;                   % Ignore this value in later scaning process
            end
            if(length(ind)>=k+1)                % Core point
                type(i)=1;                      % Core point: 1
                class(ind)=ones(length(ind),1)*max(no);     % Assign class to the border points
                figure(2)
                draw(x,no,ind,color1)                  % draw the core point
                h=circle(x,Eps,i);
                draw(x,4,i,color2)                     % draw the border points
                %pause(0.00001)                     % pause
                drawnow;
                delete(h);
                color1 = [rand(),rand(),rand()];
                color2= [rand(),rand(),rand()];
                while ~isempty(ind)             % iteration
                    ob = x(ind(1),:);           % Check whether the border points is core points
                    touched(ind(1))=1;          % Set status scanned
                    ind(1)=[];                  % remove the current point
                    %D = dist(ob(2:n),x(:,2:n)); % calculate the distance between the the current point with neighbor points
                    %i1=find(D<=Eps);            % return required points
                    i1=kdtree(x(:,2:n),ob(2:n),Eps);

                    if length(i1)>1             % if this point is not a noise point
                        class(i1)=no;           % set the label to the current label
                        if length(i1)>=k+1;     % If this point is a core point
                            type(ob(1))=1;      % Set the type with 1
                        else                    % Border point
                            type(ob(1))=0;      % Set the type with 1
                        end
                        figure(2)
                        draw(x,no,i1,color1)           % Draw the border point
                        draw(ob,4,1,color2)            % Draw the core point
                        h=circle(ob,Eps,1);
                        %pause(0.00001)             % Pause
                        drawnow;
                        delete(h)
                        figure(2)
                        draw(ob,no,1,color1)           % Draw the core point with label
                        for k1=1:length(i1)
                            if touched(i1(k1))==0   % If this point has neighbor points
                                touched(i1(k1))=1;  % Set status scanned
                                ind=[ind,i1(k1)];   % Append this points to index for latter scanning process
                                class(i1(k1))=no;   % Set the label to the current label
                            end
                        end
                    end
                end
                no = no+1;  % Add one
            end
        end
    end
    i1=find(class==0);          % If there are some points left
    class(i1)=-1;               % Set label to -1
    type(i1)=-1;                % Set type to 1;
    maxlab = max(class);        % Obtain the maximum label
    clusteridx=[];              % The points in the clusters
    clun=[];                    % The number of points in every cluster
    for ck=1:maxlab
        tidx=find(class==ck);
        clusteridx=[clusteridx;[tidx,zeros(1,m-length(tidx))]];
        %clusteridx=[clusteridx;tidx];        % The points' serial number in every cluster
        clun=[clun,length(tidx)];            % The number of points in evert cluster
    end
    disp(clun);
    hold off
end

function [D] = dist(i,x)
    [m,~] = size(x);
    D = sqrt(sum((ones(m,1)*i-x).^2'));
end

function [Eps] = epsilon(x,k)
    [m,n] = size(x);
    Eps=((prod(max(x)-min(x))*k*gamma(.5*n+1))/(m*sqrt(pi.^n))).^(1/n);
    disp('Eps');
    disp(Eps);
end
function draw(data,no,i,color)
plot(data(i,2),data(i,3),'*','Color',color,'MarkerFaceColor',color);
end

function [h]=circle(data,R,i)
alpha=0:pi/50:2*pi;%角度[0,2*pi]
%R=2;%半径
x=R*cos(alpha)+data(i,2);
y=R*sin(alpha)+data(i,3);
h=patch(x,y,'r','edgecolor','none','facealpha',0.2)
%h = plot(x,y,'r-');
%axis equal;
%axis off
%set(gcf,'color','w');

end


function [ret]=kdtree(data,obj,r)
%Mdl = createns(X,'NSMethod','kdtree','Distance','euclidean');
%IdxNN = knnsearch(Mdl,Q,'K',5);
MdlKDT = KDTreeSearcher(data);
% r-Search radius
IdxKDT = rangesearch(MdlKDT,obj,r);     % Cell
ret = IdxKDT{1};
end
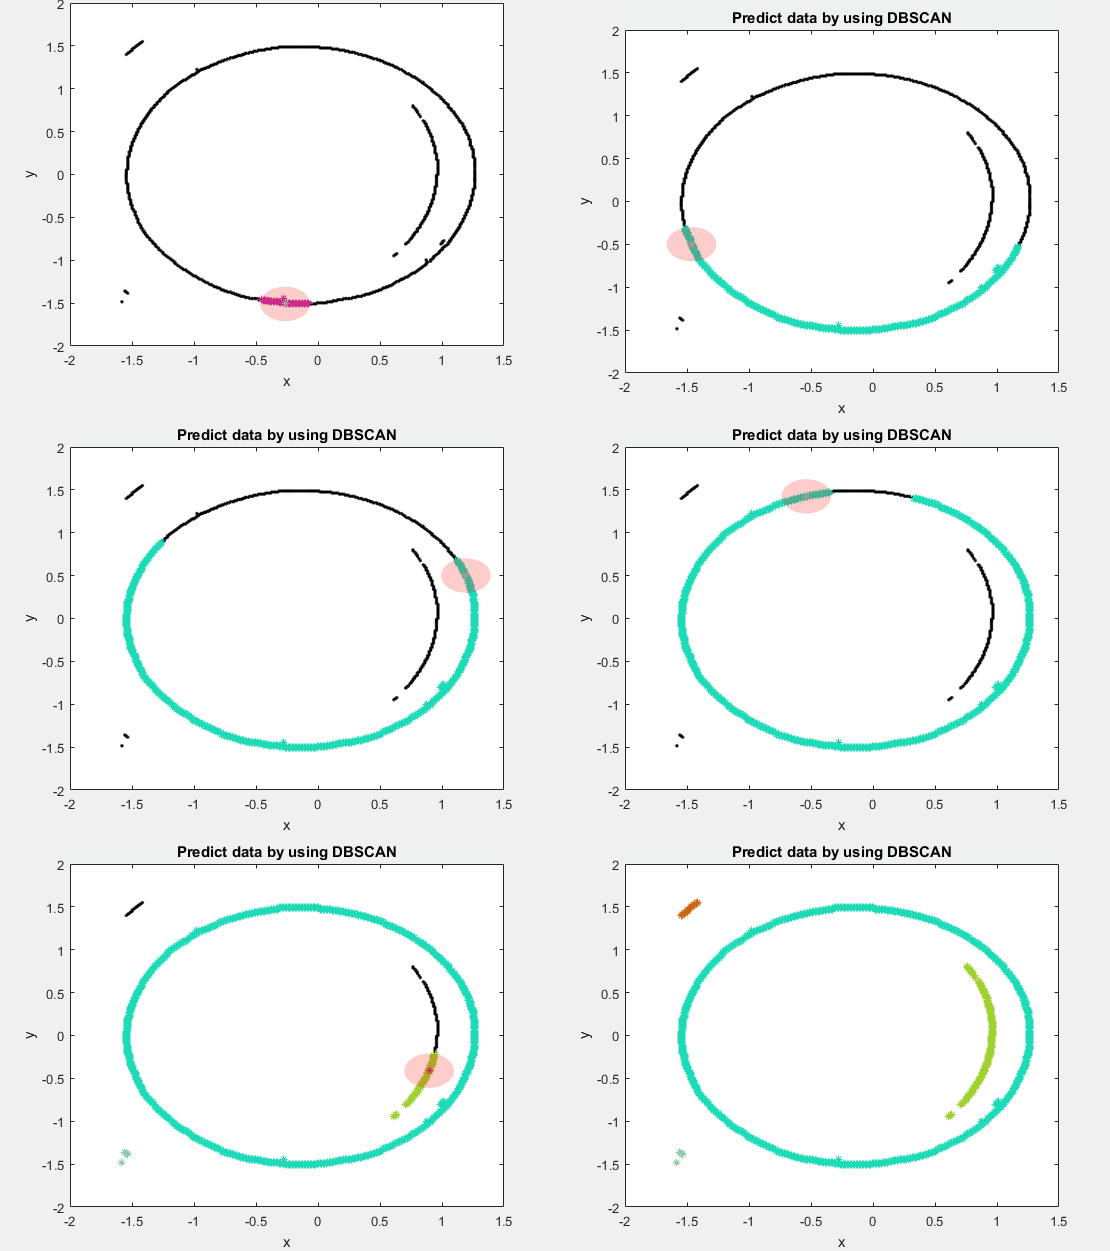
下面是测试所用图片下载链接.
下图为DBSCAN的动态展示:

DBSCAN的优点
- 不需要事先设置簇的数量
- 可以通过密度,形成不同形状的簇
- 能够识别噪声点
- 对于样本输入顺序不敏感
- 同时克服基于距离聚类算法只能发现"类圆"聚类的缺点
DBSCAN的缺点
- 不能很好的反应高维数据
- 不能很好反映数据集变化的密度
- 对于密度不均,聚类间差大的样本,聚类质量不佳
Reference
https://baike.baidu.com/item/DBSCAN/4864716?fr=aladdin
https://wenku.baidu.com/view/ce3e324aa8956bec0975e3d5.html?sxts=1562940365069&sxts=1562982214479
wenku.baidu.com/view/e823e12ee2bd960590c677d6.html