Openlayers + Vue实现GIS地图的一些常见问题(整理)
本文是博主在开发过程中遇到的一些问题的整理。
学习教程为:《WebGIS之Openlayers全面解析(第二版)》一书。
Openlayers实现离线地图的实现方案
前端: Openlayers
后端: GeoServer
基于 JavaEE 的解决方案
GeoServer(服务器)
uDig(桌面软件)
Tomact(中间件)
PostGIS|MySQL空间扩展(数据库)
OpenLayers(JS)/OpenScales(Flex)(浏览器客户端)
基础概念
坐标系
坐标原点(O)
长半轴(a)
短半轴(b)
扁率(f)
可分为两个系统
	地理坐标系(Geography Coor dinate System)
		经度、维度
		直接建立在椭球体上
	投影坐标系(Projected Coordinate System)
		米
		建立在平面上
投影转换
球面是个不可展曲面
把球面直接展开为平面时,不避免地会发生破裂或褶皱
地图投影理论
	基本原理
		球面上一点的位置决定于它的经度和纬度
		先将一些经线和纬线的交点展绘在平面上
		再将相同经度的点连成经线,相同纬度的点连成纬线,构成经纬网。
	一般按照两种标准进行分类
		按投影的变形性质分类
			等角投影
				没有角度变形
				航海、洋流和风向图
				面积变形很大,不能测量面积
			等积投影
				地质、土壤、土地利用、行政区划等地图
			任意投影
				角度和面积的变形都存在,但都适中
		按照投影的构成方式分类
			几何投影
			解析投影
比例尺
图上距离除以实际距离
比例尺越小,抽象缩小的程度越高,表达的地物就少而简单
比例尺越大,抽象缩小的程度越低,表达的地物就越详细
GIS 两大基本存储模型
矢量数据模型
	以离散的点坐标来表示地理要素,通过点、线、面以及注记来抽象表达空间实体以及实体间的关系
	明确对象的专题
	地籍数据、行政边界、街道
栅格数据模型
	以一系列栅格值来表示,基于网格结构使用不同颜色和灰度的像元来表达
	连续空间变化的专题
	呈现出河流、湖泊、地块等的形态
	遥感影像为栅格数据
WebGIS的二维地图主要分为矢量地图与瓦片地图两种形式。
矢量地图
	矢量数据模型存储的矢量数据组成的地图
	实时生成请求范围对应的地图
瓦片地图
	瓦片数据是指网格中多个类似瓦片的图片集。
	瓦片数据是通过将矢量或影像数据进行预处理,采用高效的缓存机制(即金字塔结构)形成的,采用级、行、列方式进行组织,可在网页中快速加载。
OGC(Open Geosp atial Consortium,开放地理空间信息联盟)
制定了一系列针对空间数据的服务规范
WMS、WMTS、WFS
安装最新的OpenLayers 开发环境
npm install ol
实现地图显示功能
创建一个地图容器对象(ol.Map)
通过target参数关联到地图容器(ID为map的div层)
通过layers参数设置加载瓦片图层(ol.layer.Tile)
绑定数据源(ol.source.XYZ 或其它source,如ol.source.TileWMS)
	默认情况下,遵循我们广泛使用的Google网格。如果是自定义网格,则在url模板中使用{x}、{y}、{z}占位符即可。
	如果使用GeoServer,后端的数据的服务规范可能是WMS,则使用ol.source.TileWMS。
通过view参数设置地图视图(ol.View)
开发中的问题
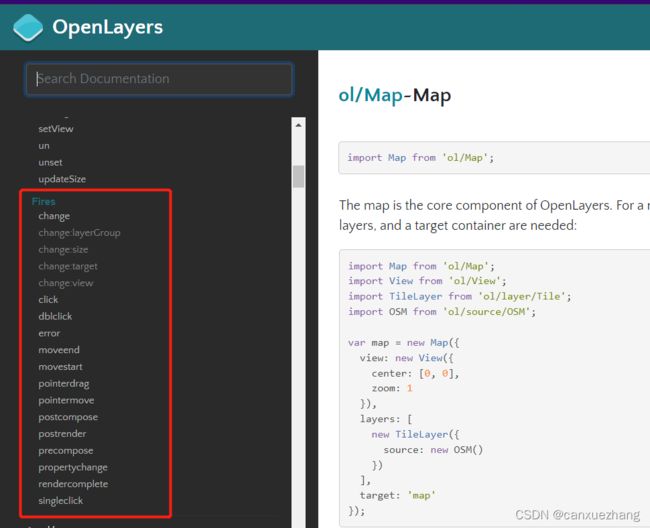
ol.Map有哪些事件
const _this = this  // JS作用域
this.map.on('click', (evt) => {
		// 点击某个元素点,做的一些操作
        let feature = _this.map.forEachFeatureAtPixel(evt.pixel,
          function (feature) {
            return feature
          })
        if (feature && feature.get('className') === 'point') {
          let data = feature.get('data')
          this.gotoAreaByCoordinate(14, [data.lon, data.lat])
        }
      })
feature点太多,ol.layer.Vector绘制的地图移动卡顿
直接改用ol.layer.VectorImage
import VectorLayer from 'ol/layer/Vector'
import VectorImageLayer from 'ol/layer/VectorImage'
	  //  原先代码
      this.vectorLineCover = new VectorLayer({
        source: source,
        style: style
      })
      // 改动后代码
      this.vectorLineCover = new VectorImageLayer({
        source: source,
        style: style
      })
设置地图可视窗口大小,可视区域
import { boundingExtent as BoundingExtent } from 'ol/extent'
const _this = this  // JS作用域
this.map = new Map({
        target: 'map',
        layers: [
          _this.basicMap,
        ],
        view: new View({
          center: _this.initCenter,
          zoom: _this.initZoom,
          minZoom: _this.GISZoomRange[0],
          maxZoom: _this.GISZoomRange[1],
          extent: new BoundingExtent([
	        [window.GISVisibleAreaRange[0], window.GISVisibleAreaRange[1]],
	        [window.GISVisibleAreaRange[2], window.GISVisibleAreaRange[3]],
	        [window.GISVisibleAreaRange[0], window.GISVisibleAreaRange[3]],
	        [window.GISVisibleAreaRange[2], window.GISVisibleAreaRange[1]]
	      ]), // 限定可视范围
        }),
        // 配置控件
        controls: defaults().extend([])
      })
设置投影
const _this = this  // JS作用域
this.map = new Map({
        view: new View({
          projection: 'EPSG:4326',   // 投影
        })
      })
设置只在一个世界展示数据
const _this = this  // JS作用域
this.map = new Map({
        view: new View({
          multiWorld: false, // 是否只在一个世界展示数据
        })
      })
Javascript移除页面一个DOM元素
使用removeChild方法
let box = document.querySelectorAll('.tooltip-hidden')
let parent = document.getElementsByClassName('ol-overlaycontainer-stopevent')[0]
 if (parent) {
   box.forEach(item => {
     parent.removeChild(item.parentNode)
   })
 }
创建DOM元素添加事件,如点击事件click
let elementDiv = document.createElement('div')
elementDiv.className = 'label-point'
let markerDiv = document.createElement('div')
markerDiv.id = 'marker'
markerDiv.className = 'marker'
markerDiv.style = `background-color: ${data.backgroundColor};`
markerDiv.addEventListener('click', function () {
  _this.dialogFunc(data)
})
elementDiv.appendChild(markerDiv)
如何对已经渲染的地图进行修改
layers和source等都是有提供get和set方法的,留意官网的这些方法。
如:获取图层新元素后更新图层
其它内容省略了,只保留要表达意思的代码,直接拷贝代码执行会报错的
this.setPointsVector()
this.map = new Map({
        layers: [
          _this.pointsVector   // 其它图层省略不写了,只留下演示的图层
        ]
      })
设置打点图层
如果source有数据,要先清空再把图层移除,不然之前的点没有被清除掉。
// 设置打点图层
setPointsVector () {
   // 如果source有数据,要先清空再把图层移除,不然之前的点没有被清除掉。
   if (this.sourcePointsVector) {
     this.sourcePointsVector.clear()
     this.map.removeLayer(this.pointsVector)   //  移除图层
   }   //  一开始就清除图层,而且加个loading效果,不然用户不知道是否是新的数据点还是久的
   const _this = this
   let features = []
   this.pointsArr.forEach(item => {
     features.push(_this.addPointsByFeature(item.coordinate, item))
     // 传入坐标,生成一个feature元素
   })
   this.sourcePointsVector = new SourceVector({
     wrapX: false,
     features: features
   })
   this.pointsVector = new VectorImageLayer({
     source: this.sourcePointsVector,
     style: new Style({
       fill: new Fill({
         color: 'rgba(255,255,255,0)' // 填充颜色
       })
     }),
     className: 'points'
   })
 }
获取点集合
// 获取点的集合
async getPointsArr () {
    let params = {
      ……
    }
    this.mapLoading = true
    const res = await this.getPoints(params)
    this.pointsArr = res
    // 设置打点图层  用图层打点
    this.setPointsVector()
    this.mapLoading = false
    this.map.addLayer(this.pointsVector)
  }
地图测距
下面是使用vue实现的测距代码,两个按钮,一个测距,一个清空已经绘制的线段。一开始清空按钮禁用。
使用了elementUI组件
HTML
<div class="box-item"">
  <el-button-group class="map-tool">
    <el-tooltip content="距离"
                placement="bottom"
                effect="light">
      <el-button type="text"
                 class="text-btn left-button"
                 :class="isDrawIng ? 'active' : ''"
                 icon="icon iconRanging"
                 @click="drawFunc()">el-button>
    el-tooltip>
    <el-button type="text"
               class="text-btn right-button"
               :disabled="clearDrawDisabled"
               icon="icon iconEliminate"
               @click="deleteDrawFunc()">el-button>
  el-button-group>
div>
JavaScript
data
data () {
	return {
		// 地图对象
		map: null,
		// 地图瓦片底图
		basicMap: null,
		// 初始化图层级数和中心
		initZoom: 9,
		initCenter: [108.93, 34.27],
		// 地图可见区域
		showRange: [
		  [window.GISVisibleAreaRange[0], window.GISVisibleAreaRange[1]],
		  [window.GISVisibleAreaRange[2], window.GISVisibleAreaRange[3]],
		  [window.GISVisibleAreaRange[0], window.GISVisibleAreaRange[3]],
		  [window.GISVisibleAreaRange[2], window.GISVisibleAreaRange[1]]
		],
		// 测距清除是否禁用
		clearDrawDisabled: true,
		// 控制点击测距时样式高亮
		isDrawIng: false,
		// 测距的图层
		drawVector: null,
		// 测距数据源
		drawSourceVector: null,
		//  绘制要素
		sketch: null,
		//  测量工具提示框
		measureTooltipElement: null,
		measureTooltip: null,
		// 测距时添加提示框
		helpTooltipElement: null,
		helpTooltip: null,
		// 监听测距是否完成
		listener: null,
		// 测距绘制完成后线段的样式
		drawFinalStyle: new Style({
		  fill: new Fill({
		    color: 'rgba(255,255,255,0)' // 填充颜色
		  }),
		  stroke: new Stroke({
		    color: '#9c0a39', // 边框颜色
		    width: 2 // 边框宽度
		  }),
		  image: new Circle({
		    radius: 7,
		    fill: new Fill({
		      color: '#c2144b'
		    })
		  })
		}),
		// 测距过程中点状虚线样式
		drawDonateStyle: new Style({
		  fill: new Fill({
		    color: 'rgba(255,255,255,0.2)'
		  }),
		  stroke: new Stroke({ // 边线样式
		    color: 'rgb(222,7,7)',
		    lineDash: [10, 10],
		    width: 2
		  }),
		  image: new Circle({ // 点样式
		    radius: 5,
		    stroke: new Stroke({
		      color: 'rgba(223,5,5,0.7)'
		    }),
		    fill: new Fill({
		      color: 'rgba(255,255,255,0.2)'
		    })
		  })
		})
	}
}
引用库中的类
import TileLayer from 'ol/layer/Tile'
import { Map, Overlay, View } from 'ol'
import { defaults } from 'ol/control'
import SourceVector from 'ol/source/Vector'
import VectorImageLayer from 'ol/layer/VectorImage'
import { Circle, Fill, Stroke, Style } from 'ol/style'
import GeoJSON from 'ol/format/GeoJSON'
import Feature from 'ol/Feature'
import { getLength } from 'ol/sphere'
import Draw from 'ol/interaction/Draw'
import { unByKey } from 'ol/Observable'
import { boundingExtent as BoundingExtent } from 'ol/extent'
初始测距图层
// 设置测距图层
setDrawFloor () {
  this.drawSourceVector = new SourceVector({ wrapX: false })
  this.drawVector = new VectorImageLayer({
    source: this.drawSourceVector,
    style: drawFinalStyle,
    className: 'draw'
  })
}
初始化地图时初始化测距的图层
// 绘画地图瓦片底图
initMap () {
  // 瓦片图层
  this.basicMap = new TileLayer({
    source: this.mapSource[this.mapSourceName]  // 项目自己的地图
  })
  const _this = this
  this.map = new Map({
    target: 'map',
    layers: [
      _this.basicMap,
      _this.drawVector
    ],
    view: new View({
      center: _this.initCenter,
      zoom: _this.initZoom,
      minZoom: window.GISZoomRange[0],
      maxZoom: window.GISZoomRange[1],
      projection: 'EPSG:4326',
      multiWorld: false, // 是否只在一个世界展示数据
      extent: new BoundingExtent(_this.showRange), // 限定可视范围
      constrainResolution: true // 因为存在非整数的缩放级别,所以设置该参数为true来让每次缩放结束后自动缩放到距离最近的一个整数级别,这个必须要设置,当缩放在非整数级别时地图会糊
    }),
    // 配置控件
    controls: defaults().extend([])
  })
}
// 设置测距图层初始化
this.setDrawFloor()
this.initMap()
开始测距
// 测距
drawFunc () {
  this.isDrawIng = true
  const _this = this
  let type = 'LineString' // 设置测距类型为线段
  let draw = new Draw({
    source: this.drawSourceVector, // 测距图层数据源
    type: (type), // 几何图形类型
    style: this.drawDonateStyle
  })
  this.map.addInteraction(draw) // 将给定的交互添加到地图
  this.createMeasureTooltip() // 创建测试工具提示框
  this.createHelpTooltip() // 创建帮助信息提示框
  // 为交互式图形绘制控件对象绑定drawstart事件
  draw.on('drawstart', function (evt) {
    _this.sketch = evt.feature // 绘制要素
    let tooltipCoordinate = evt.coordinate // 绘制的坐标
    // 绑定change事件,根据绘制几何图形类型得到测量的距离,并将其添加到测量工具提示框中显示
    _this.listener = _this.sketch.getGeometry().on('change', function (evt) {
      let geom = evt.target // 绘制的几何图形
      let output = _this.formatLength((geom))
      tooltipCoordinate = geom.getLastCoordinate() // 坐标,返回几何体的最后一个坐标。
      // 将测量值添加到测量工具提示框中显示
      _this.measureTooltipElement.innerHTML = output
      // 设置测量工具提示框的显示位置
      _this.measureTooltip.setPosition(tooltipCoordinate)
    })
  }, this)
  draw.on('drawend', function () {
    // 设置测量工具提示框的样式
    _this.measureTooltipElement.className = 'draw-tooltip tooltip-static'
    _this.measureTooltip.setOffset([0, -7])
    _this.sketch = null // 置空当前绘图要素对象
    _this.measureTooltipElement = null // 置空测量工具提示框对象
    _this.createMeasureTooltip() // 重新创建一个测量工具提示框显示结果
    unByKey(_this.listener)
    _this.map.un('pointermove', _this.pointerMoveHandler)  // un : 不监听某种类型的事件
    _this.map.removeInteraction(draw)  // 从地图中删除给定的交互
    _this.measureTooltipElement.classList.add('tooltip-hidden')
    _this.helpTooltipElement.classList.add('tooltip-hidden')
    let box = document.querySelectorAll('.tooltip-hidden')
    let parent = document.getElementsByClassName('ol-overlaycontainer-stopevent')[0]
    if (parent) {
      box.forEach(item => {
        parent.removeChild(item.parentNode)
      })
    }
    _this.isDrawIng = false
    _this.clearDrawDisabled = false
  }, this)
  this.map.on('pointermove', this.pointerMoveHandler) // 绑定鼠标移动事件,动态显示帮助信息提示框
  this.map.getViewport().addEventListener('mouseout', function () {
    _this.helpTooltipElement.classList.add('tooltip-hidden')
  })
},
draw的事件

工具函数
// 创建帮助信息提示框
createMeasureTooltip () {
  if (this.measureTooltipElement) {
    this.measureTooltipElement.parentNode.removeChild(this.measureTooltipElement)
  }
  this.measureTooltipElement = document.createElement('div')
  this.measureTooltipElement.className = 'draw-tooltip tooltip-measure'
  this.measureTooltip = new Overlay({
    element: this.measureTooltipElement,
    offset: [0, -15],
    positioning: 'bottom-center'
  })
  this.map.addOverlay(this.measureTooltip)
},
// 创建测距工具提示框
createHelpTooltip () {
  if (this.helpTooltipElement) {
    this.helpTooltipElement.parentNode.removeChild(this.helpTooltipElement)
  }
  this.helpTooltipElement = document.createElement('div')
  this.helpTooltipElement.className = 'draw-tooltip tooltip-hidden'
  this.helpTooltip = new Overlay({
    element: this.helpTooltipElement, // 关联帮助信息提示框的目标元素
    offset: [15, 0],
    positioning: 'center-left'
  })
  this.map.addOverlay(this.helpTooltip)
},
// 测距计算距离函数
formatLength (line) {
  // 若使用测地学方法测量
  let sourceProj = this.map.getView().getProjection() // 地图数据源投影坐标系
  let length = getLength(line, {
    'projection': sourceProj,
    'radius': 6378137 // 球体半径。默认情况下,使用 WGS84 椭球的平均地球半径。
  })
  let output
  if (length > 100) {
    output = (Math.round(length / 1000 * 100) / 100) + '' + 'km' // 以km为单位
  } else {
    output = (Math.round(length * 100) / 100) + '' + 'm' // 以m为单位
  }
  return output // 返回线的距离
},
// 鼠标移动时触发事件,动态显示帮助信息提示框
pointerMoveHandler (evt) {
  if (evt.dragging) {
    return
  }
  let helpMsg = '移到起点单击鼠标左键开始测距' // 当前默认的提示信息,字符串类型
  if (this.sketch) {
    helpMsg = '如果是路线拐点请单击鼠标左键,终点请双击鼠标左键' // 绘制线时提示相应的内容
  }
  this.helpTooltipElement.innerHTML = helpMsg // 将提示信息添加到帮助信息提示框中显示
  this.helpTooltip.setPosition(evt.coordinate) // 设置帮助信息提示框的位置
  this.helpTooltipElement.classList.remove('tooltip-hidden') // 移除帮助信息提示框的隐藏样式
},
// 清空绘制的测距
deleteDrawFunc () {
  this.clearDrawDisabled = true
  // 清除图层的绘画元素
  this.drawVector.getSource().clear()
  let box = document.querySelectorAll('.draw-tooltip')
  let parent = document.getElementsByClassName('ol-overlaycontainer-stopevent')[0]
  if (parent) {
    box.forEach(item => {
      parent.removeChild(item.parentNode)
    })
  }
}
样式
两个按钮的样式
.box-item {
  line-height: 50px;
  text-align: center;
  display: flex;
  flex-direction: row;
  justify-content: center;
  align-items: center;

  .text-btn {
    width: 30px;
    height: 30px;
    background: #fff;

    /deep/ .iconfont {
      font-size: 16px !important;
    }

    &.left-button {
      border-top-left-radius: 5px;
      border-bottom-left-radius: 5px;
      border-right: 1px solid rgba(108, 94, 94, 0.2);
      z-index: 12;
    }

    &.active {
      border: 1px solid #51BEFE !important;
    }

    &.right-button {
      border-top-right-radius: 5px;
      border-bottom-right-radius: 5px;
    }
  }

  .el-radio-group {
    display: flex;
    flex-wrap: nowrap;
    flex-direction: row;
  }
}
地图提示框样式
#map {
  width: 100%;
  height: 100%;
}

/deep/ .ol-overlaycontainer-stopevent {
  position: relative;

  .ol-zoom {
    display: none;
  }

  .ol-scale-line {
    position: fixed;
    left: 5px;
    bottom: 10px;
  }

  .ol-rotate,
  .ol-attribution,
  .ol-mouse-position {
    display: none;
  }
}

/deep/ .draw-tooltip {
  position: relative;
  background: transparent;
  border-radius: 4px;
  color: #000;
  font-size: 16px;
  font-weight: bold;
  padding: 4px 8px;
  opacity: 0.7;
  white-space: nowrap;
}

/deep/ .tooltip-measure {
  opacity: 1;
  font-weight: bold;
}

/deep/ .tooltip-static {
  background: transparent;
  color: #cb0000;
  font-weight: bold;
  background: #fff;
  border: 1px solid white;
}

/deep/ .tooltip-measure::before,
/deep/ .tooltip-static::before {
  border-top: 6px solid rgba(0, 0, 0, 0.5);
  border-right: 6px solid transparent;
  border-left: 6px solid transparent;
  content: '';
  position: absolute;
  bottom: -6px;
  margin-left: -7px;
  left: 50%;
}

/deep/ .tooltip-static::before {
  border-top-color: #cb0000;
}