python 系列 04 - 解析及创建PDF
文章目录
- 1. python常用pdf库
- 2.读取测试
-
- 2.1 PyPDF2 示例及结果
- 2.2 PyPDF4 示例及结果
- 2.3 pikepdf
- 2.4 pdfplumber 示例和结果
- 2.5 PyMuPDF 示例及结果
- 2.6 borb示例及结果
- 3. 读取PDF
-
- 3.1 读取PDF元数据信息
- 3.2 获取PDF页信息
- 3.3 提取文本
- 3.4 提取图像
- 3.5 提取表格
-
- 3.5.1 表格策略的应用
- 4 创建PDF
-
- 4.1 创建文本内容
- 4.2 创建表格
- 4.3 表单
-
- 4.3.1 复选框
- 4.3.2 其它表单元素:
- 4.4 图片
- 5 一个比较完整的例子
1. python常用pdf库
| 名称 | 特点 |
|---|---|
| PyPDF2 | 已不再维护,继任者PyPDF4 ,但很长时间没有更新了,能读不能写 |
| pdfrw | 能读不能写,但可以兼容ReportLab写 |
| ReportLab | 商业版的开源版本,能写不能读 |
| pikepdf | 能读不能写 |
| pdfplumber | 能读不能写 |
| PyMuPDF | 读写均可,基于GPL协议 |
| borb | 纯Python库,支持读、写,基于GPL协议 |
其中前几种偏重于读或者写,PyMuPDF和borb读写兼具,但这两个库都基于GPL开源协议,对于商业开发不太友好。
介绍之前,我们通过读取一个已有的PDF中的文字来测试下时提取内容的准确度,pdfrw暂时跳过,因为没有找到其提取文本的api。ReportLab不能读,跳过。
2.读取测试
2.1 PyPDF2 示例及结果
#!/usr/bin/python
from PyPDF2 import PdfReader
pdf = PdfReader("yz.pdf")
page = pdf.pages[4]
print(page.extract_text())
内容被正确读取,但是格式变为每行一个字。
2.2 PyPDF4 示例及结果
from PyPDF4 import PdfFileReader

pdf = open('yz.pdf','rb')
reader = PdfFileReader(pdf)
page = reader.getPage(4)
print(page.extractText().strip())
2.3 pikepdf
pikepdf 的官方文档上有这么一段话:
If you guessed that the content streams were the place to look for text inside a PDF – you’d be correct.
Unfortunately, extracting the text is fairly difficult because content stream actually specifies as a font
and glyph numbers to use. Sometimes, there is a 1:1 transparent mapping between Unicode numbers and
glyph numbers, and dump of the content stream will show the text. In general, you cannot rely on there
being a transparent mapping; in fact, it is perfectly legal for a font to specify no Unicode mapping
at all, or to use an unconventional mapping (when a PDF contains a subsetted font for example).

We strongly recommend against trying to scrape text from the content stream.

pikepdf does not currently implement text extraction. We recommend pdfminer.six, a read-only
text extraction tool. If you wish to write PDFs containing text, consider reportlab.

如果您猜测内容流是在PDF中查找文本的地方,那么您是正确的。不幸的是,提取文本相当困难,因为内容流实际上指定了要使用的字体和字形
数字。有时,Unicode数字和字形数字之间有1:1的透明映射,内容流的转储将显示文本。一般来说,你不能依赖于一个透明的映射;事实上,
字体完全可以不指定Unicode映射,或者使用非常规的映射(例如,当PDF包含一个子集字体时)。

我们强烈建议不要尝试从内容流中抓取文本。

Pikepdf目前不实现文本提取。我们推荐pdfminer。一个只读文本提取工具。如果您希望编写包含文本的pdf,请考虑reportlab。
2.4 pdfplumber 示例和结果
import pdfplumber

with pdfplumber.open("yz.pdf") as pdf:
    page = pdf.pages[4]
    chars = page.chars
    content = ''
    for char in chars:
        content += char['text']
    print(content)
pdfplumber是按字符读取,上面的示例代码中是对字符进行了拼接。结果如下:

2.5 PyMuPDF 示例及结果
import fitz
doc = fitz.open("yz.pdf")
page = doc.load_page(4)
text = page.get_text("text")
print(text)
这是目前提取文本结果最完美的一个:
$ python e6.py
1897年,在这里,什么都没有发生。
——科罗拉多州伍迪克里克小旅馆墙壁上的牌匾
2.6 borb示例及结果
以下示例代码为官方示例代码:
import typing
from borb.pdf import Document
from borb.pdf import PDF
from borb.toolkit import SimpleTextExtraction

def main():
    # read the Document
    doc: typing.Optional[Document] = None
    l: SimpleTextExtraction = SimpleTextExtraction()
    with open("yz.pdf", "rb") as in_file_handle:
        doc = PDF.loads(in_file_handle, [l])

    # check whether we have read a Document
    assert doc is not None

    # print the text on the first Page
    print(l.get_text()[4])
if __name__ == "__main__":
    main()
  # 处理字体时报错
  File "/home/eva/.local/lib/python3.11/site-packages/borb/pdf/canvas/font/composite_font/font_type_0.py",
   line 86, in character_identifier_to_unicode
    assert encoding_name in ["Identity", "Identity-H"]
           ^^^^^^^^^^^^^^^^^^^^^^^^^^^^^^^^^^^^^^^^^^^
AssertionError
鉴于以上测试结果,接下来的演示中将使用pdfplumber + Reportlab 来进行.
3. 读取PDF
3.1 读取PDF元数据信息
示例代码很简单,不再解释,直接看代码:
import pdfplumber

with pdfplumber.open("yz.pdf") as pdf:
    print(pdf.metadata)
#返回结果是一个字典,看key就知道是什么属性了。不再解释。
{'ModDate': "D:20220602170530+08'00'", 'Producer': 'calibre 3.23.0 [https://calibre-ebook.com]', 'Title': '无中生有的宇宙',
'Author': '[加]劳伦斯·克劳斯;王岚译', 'Creator': 'calibre 3.23.0 [https://calibre-ebook.com]',
'CreationDate': "D:20220505133234+00'00'"}
3.2 获取PDF页信息
示例代码如下:
import pdfplumber

with pdfplumber.open("yz.pdf") as pdf:
    #返回所有页实例
    #这里就不再输出所有的页实例,因为这篇文档有155页,输出结果比较长。
    pages = pdf.pages

    #这里还以第五页为例
    page = pages[4]

    print("页码:"+str(page.page_number))
    print("页宽:"+str(page.width))
    print("页高:"+str(page.height))
    #print("页面包含对象:")
    #print(page.objects)
    #print("页面包含字符:")
    #print(page.chars)
    print("页面包含线条:")
    print(page.lines)
    print("页面包含矩形:")
    print(page.rects)
    print("页面包含曲线:")
    print(page.curves)

    page1 = pages[34]
    print("页面包含图像:")
    print(page1.images)

    page.flush_cache()
    page1.flush_cache()
示例运行结果
页码:5
页宽:612
页高:792
页面包含对象:
{'char': [{'matrix': (0.75, 0.0, 0.0, 0.75, 102.0, 691.5), 'fontname': 'AAAAAB+LiberationSerif', 'adv': 10.0,
'upright': True, 'x0': 102.0, 'y0': 688.26, 'x1':.... #省略部分
页面包含字符:
[{'matrix': (0.75, 0.0, 0.0, 0.75, 102.0, 691.5), 'fontname': 'AAAAAB+LiberationSerif', 'adv': 10.0, 'upright': True, '
x0': 102.0, 'y0': 688.26, 'x1': 109..... #省略
页面包含线条:
[]
页面包含矩形:
[]
页面包含曲线:
[]
页面包含图像:
[{'x0': 72.0, 'y0': 81.75, 'x1': 540.0, 'y1': 720.0, 'width': 468.0, 'height': 638.25, 'name': 'Image0',
'stream': <PDFStream(96): raw=289354, {'ColorSpace': /'DeviceRGB', 'Width': 2044, 'BitsPerComponent': 8, 'Length': 289354,
'Height': 2789, 'DL': 289354, 'Filter': [/'DCTDecode'], 'Type': /'XObject', 'Subtype': /'Image'}>, 'srcsize': (2044, 2789),
 'imagemask': None, 'bits': 8, 'colorspace': [/'DeviceRGB'], 'object_type': 'image', 'page_number': 35, 'top': 72.0,
 'bottom': 710.25, 'doctop': 27000.0}]
其中char对象的属性如下:
| 属性 | 说明 |
|---|---|
| page_number | 找到此字符的页码。 |
| text | 文本内容 例: “z”, 或 “Z” 或 " ". |
| fontname | 字体 |
| size | 字号 |
| adv | 等于文本宽度字体大小比例因子。 |
| upright | 是否垂直 |
| height | 文本高度 |
| width | 文本高度 |
| x0 | 其左侧与页面左侧的距离。 |
| x1 | 其右侧与页面左侧的距离。 |
| y0 | 其下侧与页面底部的距离。 |
| y1 | 其上侧与页面底部的距离。 |
| top | 其上侧与页面顶部的距离。 |
| bottom | 其下侧与页面顶部的距离。 |
| doctop | 其顶部与文档顶部的距离。 |
| matrix | 其“变换矩阵”。(详见下文) |
| stroking_color | 笔划的颜色,表示为元组或整数,具体取决于使用的“颜色空间”。 |
| non_stroking_color | 字体填充颜色 |
| object_type | 对象类型:“char” |
line对象属性
| 属性 | 说明 |
|---|---|
| page_number | 其所在的页码 |
| height | 高度 |
| width | 宽度 |
| x0 | 其左侧与页面左侧的距离。 |
| x1 | 其右侧与页面左侧的距离。 |
| y0 | 其下侧与页面底部的距离。 |
| y1 | 其上侧与页面底部的距离。 |
| top | 其上侧与页面顶部的距离。 |
| bottom | 其下侧与页面顶部的距离。 |
| doctop | 其顶部与文档顶部的距离。 |
| linewidth | 线粗 |
| stroking_color | 线条颜色,表示为元组或整数,具体取决于使用的“颜色空间” |
| non_stroking_color | 线条填充颜色。 |
| object_type | 对象类型:“line” |
rect属性
| 属性 | 说明 |
|---|---|
| page_number | 其所在的页码 |
| height | 高度 |
| width | 宽度 |
| x0 | 其左侧与页面左侧的距离。 |
| x1 | 其右侧与页面左侧的距离。 |
| y0 | 其下侧与页面底部的距离。 |
| y1 | 其上侧与页面底部的距离。 |
| top | 其上侧与页面顶部的距离。 |
| bottom | 其下侧与页面顶部的距离。 |
| doctop | 其顶部与文档顶部的距离。 |
| linewidth | 线粗 |
| stroking_color | 线条颜色,表示为元组或整数,具体取决于使用的“颜色空间” |
| non_stroking_color | 线条填充颜色。 |
| object_type | 对象类型:“rect” |
curve属性
| 属性 | 说明 |
|---|---|
| page_number | 其所在的页码 |
| points | Points — 描述曲线的点列表包含 (x, top) 元组 |
| height | 曲线边界框的高度。 |
| width | 曲线边界框的宽度。 |
| x0 | 曲线最左侧点与页面左侧的距离。 |
| x1 | 曲线最右侧点与页面左侧的距离。 |
| y0 | 曲线最低点到页面底部的距离。 |
| y1 | 曲线最高点到页面底部的距离。 |
| top | 曲线最高点到页面顶部的距离。 |
| bottom | 曲线最低点到页面底部的距离。 |
| doctop | 曲线最高点到文档顶部的距离。 |
| linewidth | 线粗 |
| fill | 是否填充曲线路径定义的形状. |
| stroking_color | 曲线轮廓的颜色,表示为元组或整数,具体取决于使用的“颜色空间”。 |
| non_stroking_color | 曲线填充颜色 |
| object_type | 对象类型:“curve” |
3.3 提取文本
提取文本上面示例演示过了,主要操作就是获取pages,让后循环获取page上的char对象,char对象的text属性里既是文本内容,在循环里拼接text即可。
3.4 提取图像
这里将本文档35页的图片保存为文件:
import pdfplumber

with pdfplumber.open("yz.pdf") as pdf:
    pages = pdf.pages
    page = pages[34]
    img = page.to_image()
    #清除图像
    #img.reset()
    #拷贝图像
    #img.copy()
    #调用本机默认图片查看工具预览图像
    #img.show()
    #保存图像
    img.save("/home/eva/下载/test.png",format="PNG")
    page.flush_cache()
保存的图像:

如果pdf文档是从被的地方抓取,或者批量处理,不知道页面内容的情况下,则可以先判断页面是否包含图像,下面一个示例展示提取PDF文档内的所有图像:
import pdfplumber


with pdfplumber.open("yz.pdf") as pdf:
    #所有页面
    pages = pdf.pages
    for index,page in enumerate(pages):
        #判断页面是否包含图像
        if len(page.images) > 0:
            img = page.to_image()
            img.save("/home/eva/下载/test"+str(index)+".png",format="PNG")
        page.flush_cache()
这种方式的不足之处在于,只要页面包含图像,哪怕页面同时包含文字和图像,page.to_image()就会将整个页面转换成图像。而不是只保存图像部分。pdfplumber并没有提供可以精确保存图片的方法,如果对图像边界有精确的要求的话,可以对保存下来的图片进行裁剪,比如,pdfplumber返回的图片对象是有定位的,如下所示:x0是图片距离左边的距离。top是图片距离页面顶部,x0,top即组成图片左上角的座标,x1和bottom组成图片左下角的座标。至于y0,y1计算的是距离页面底部的数据,这里用不到。
[{'x0': 212.25, 'y0': 471.0, 'x1': 399.75, 'y1': 720.0, 'width': 187.5, 'height': 249.0,
'name': 'Image0', 'stream': <PDFStream(207): raw=204521, {'ColorSpace': /'DeviceRGB',
'Width': 963, 'BitsPerComponent': 8, 'Length': 204521, 'Height': 1282, 'DL': 204521,
'Filter': [/'DCTDecode'], 'Type': /'XObject', 'Subtype': /'Image'}>, 'srcsize': (963, 1282),
'imagemask': None, 'bits': 8, 'colorspace': [/'DeviceRGB'], 'object_type': 'image',
'page_number': 78, 'top': 72.0, 'bottom': 321.0, 'doctop': 61056.0}]
以下示例代码是截取图片:
import pdfplumber
from PIL import Image

import time


with pdfplumber.open("yz.pdf") as pdf:
    #所有页面
    pages = pdf.pages
    page = pages[77]
    img = page.to_image()
    img.save("/home/eva/下载/test.png",format="PNG")

    #取图像的左上和右下座标
    image = page.images[0]
    x0 = image['x0']
    top = image['top']
    x1 = image['x1']
    bottom = image['bottom']

    page.flush_cache()

    #图片裁剪,此处用到的图片库是pillow
    #pip install pillow 或 pip3 install pillow安装即可
    png = Image.open('/home/eva/下载/test.png')
    region = png.crop((x0,top,x1,bottom))
    region.save('/home/eva/下载/test1.png')
3.5 提取表格
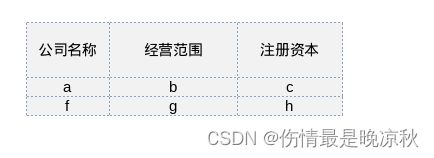
之前的示例pdf并不包含表格,也没有找到带表格的pdf.所有创建了一个单页PDF,内容如下:

提取表格的示例:
import pdfplumber

with pdfplumber.open("bg.pdf") as pdf:
    #所有页面
    pages = pdf.pages
    for page in pages:
        #获取表格
        tables = page.find_tables()
        if len(tables) > 0:
            #提取表格内容(提取页面所有表格)
            content = page.extract_tables()
            print(content)
            #提取页面最大表格
            #content = page.extract_table()
提取结果:
#返回结果是多维数组,结构为 表 -> 行 -> 单元格
[['Test1', 'Test2', 'Test3', 'Test4', 'Test5'], ['aa', 'bb', 'cc', 'dd', 'ee'], ['ff', 'gg', 'Hh', 'Ii', 'gg']]
其中extract_tables()和extract_table()两个方法可以包含参数,用以配置提取属性,可配置的属性如下:
{
    "vertical_strategy": "lines",
    "horizontal_strategy": "lines",
    "explicit_vertical_lines": [],
    "explicit_horizontal_lines": [],
    "snap_tolerance": 3,
    "snap_x_tolerance": 3,
    "snap_y_tolerance": 3,
    "join_tolerance": 3,
    "join_x_tolerance": 3,
    "join_y_tolerance": 3,
    "edge_min_length": 3,
    "min_words_vertical": 3,
    "min_words_horizontal": 1,
    "keep_blank_chars": False,
    "text_tolerance": 3,
    "text_x_tolerance": 3,
    "text_y_tolerance": 3,
    "intersection_tolerance": 3,
    "intersection_x_tolerance": 3,
    "intersection_y_tolerance": 3,
}
关于以上属性的说明:
| 配置项 | 说明 |
|---|---|
| “vertical_strategy” | 垂直策略,可选值 “lines”, “lines_strict”, “text”, “explicit”,见后续说明 |
| “horizontal_strategy” | 水平策略,可选值 “lines”, “lines_strict”, “text”, “explicit”. 见后续说明 |
| “explicit_vertical_lines” | 明确划分表中单元格的垂直线列表。可与上述任何策略结合使用。列表中的项目应该是数字(表示一条直线的x坐标,即页面的全高)或 line/rect/curve对象。 |
| “explicit_horizontal_lines” | 明确划分表中单元格的水平线列表。可与上述任何策略结合使用。列表中的项目应该是数字(表示一条直线的y坐标即页面的全高)或 line/rect/curve对象。 |
| “snap_tolerance”, “snap_x_tolerance”, “snap_y_tolerance” | snap_tolerance像素内的平行线将“捕捉”到相同的水平或垂直位置。 |
| “join_tolerance”, “join_x_tolerance”, “join_y_tolerance” | 同一条无限线上的线段,其端点在彼此的join_tolerance范围内,将“连接”为一条线段 |
| “edge_min_length” | 在尝试重建表之前,将丢弃小于edge_min_length的边 |
| “min_words_vertical” | 使用 “horizontal_strategy”: "text"时,至少 min_words_horizontal单词必须共享相同的对齐方式。 |
| “min_words_horizontal” | 使用 “horizontal_strategy”: "text"时,至少min_words_horizontal单词必须共享相同的对齐方式。 |
| “keep_blank_chars” | 使用 text 策略时, 空格符" "将视为单词的一部分而不是单词分隔符 |
| “text_tolerance”, “text_x_tolerance”, “text_y_tolerance” | 当 text 策略搜索单词时,期望每个单词中的单个字母之间的距离不超过text_tolerance像素。 |
| “intersection_tolerance”, “intersection_x_tolerance”, “intersection_y_tolerance” | 将边组合到单元格中时,正交边必须在intersection_tolerance 像素范围内才能视为相交。 |
表格提取策略
vertical_strategy(垂直策略) 及 horizontal_strategy(水平策略)均包含以下选项:
| 策略 | 说明 |
|---|---|
| “lines” | 使用页面的图形线(包括矩形对象的边)作为潜在表格单元格的边框。 |
| “lines_strict” | 使用页面的图形线(而不是矩形对象的边)作为潜在表格单元格的边框。 |
| “text” | 对于vertical_strategy(垂直策略):推导连接页面上单词的左、右或中心的(假想的)行,并将这些行用作潜在表格单元格的边框。对于horizontal_strategy,相同操作,但使用单词的顶部。 |
| “explicit” | 仅使用explicit_vertical_lines / explicit_horizontal_lines中明确定义的线。 |
3.5.1 表格策略的应用
代码示例,使用垂直策略,并将策略模式分别修改为lines,lines_strict,text.
代码示例:
import pdfplumber

with pdfplumber.open("bg1.pdf") as pdf:
    #所有页面
    pages = pdf.pages
    for page in pages:
        #获取表格
        tables = page.find_tables()
        print(tables)
        if len(tables) > 0:
            #提取表格内容(提取页面所有表格)
            content = page.extract_tables()
            print("无策略:")
            print(content)


            content1 = page.extract_tables({
                "vertical_strategy":"lines"
            })
            print("垂直策略使用lines:")
            print(content1)

            content2 = page.extract_tables({
                "vertical_strategy":"lines_strict"
            })
            print("垂直策略使用lines_strit:")
            print(content2)

            content3 = page.extract_tables({
                "vertical_strategy":"text"
            })
            print("垂直策略使用text:")
            print(content3)
提取结果:
[<pdfplumber.table.Table object at 0x7fcd17df0410>]
无策略:
[[['公司名称', '经营范围', '注册资本'], ['a', 'b', 'c'], ['f', 'g', 'h']]]
垂直策略使用lines:
[[['公司名称', '经营范围', '注册资本'], ['a', 'b', 'c'], ['f', 'g', 'h']]]
垂直策略使用lines_strit:
[[['经营范围'], ['b'], ['g']]]
垂直策略使用text:
[[['公司名称', '经营范围', '注册资本'], ['a', 'b', 'c'], ['f', 'g', 'h']]]
可以发现,当垂直策略使用lines_strict时,第一列和最后一列的内容没有提取出来。是因为lines_strict只使用明确的图形线来定义列。而lines无图形线时使用潜在的矩形边框。当有图形线时,text模式并不影响结果,text模式主要用于没有图形线时通过文本格式进行推导。
提取结果:
[<pdfplumber.table.Table object at 0x7fbbf4832d10>]
无策略:
[[['公司名称', '经营范围', '注册资本'], ['a', 'b', 'c'], ['f', 'g', 'h']]]
垂直策略使用lines:
[[['公司名称', '经营范围', '注册资本'], ['a', 'b', 'c'], ['f', 'g', 'h']]]
垂直策略使用lines_strit:
[]
垂直策略使用text:
[[['公司名称', '经营范围', '注册资本'], ['a', 'b', 'c'], ['f', 'g', 'h']]]
可以发现,当lines_strict无法提取内容时,text依旧可以提取内容。lines模式同样可以提取是因为使用了潜在的矩形边框,因为pdf的内容是由excel拷贝并生成的。下面准备无格式的内容,:
代码示例:
import pdfplumber

with pdfplumber.open("bg1.pdf") as pdf:
    #所有页面
    pages = pdf.pages
    for page in pages:
        #获取表格
        tables = page.find_tables()
        print("页面表格:")
        print(tables)

        #提取表格内容(提取页面所有表格)
        content1 = page.extract_tables({
            "vertical_strategy":"lines"
        })
        print("垂直策略使用lines:")
        print(content1)

        content2 = page.extract_tables({
            "vertical_strategy":"lines_strict"
        })
        print("垂直策略使用lines_strit:")
        print(content2)

        content3 = page.extract_tables({
            "vertical_strategy":"text"
        })
        print("垂直策略使用text:")
        print(content3)
提取结果如下:
页面表格:
[]
垂直策略使用lines:
[]
垂直策略使用lines_strit:
[]
垂直策略使用text:
[]
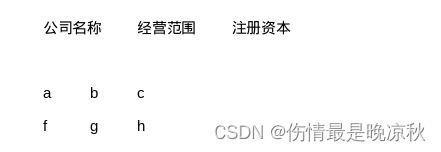
相当于纯文本,无识别出表格,下面添加一些边框,让数据有一些格式:
提取结果:
页面表格:
[]
垂直策略使用lines:
[]
垂直策略使用lines_strit:
[]
垂直策略使用text:
[[['公司名称', '经营范围']]]
总的来说,当页面有规范的表格时,不利用策略模式,即无参方法提取即可。当页面无表格时,但有规范格式的数据时,可使用text策略模式提取。
水平策略同样如此,只是水平策略的lines_strict结果取决于表格内容的横向边框(图形线)。在此就不多做介绍了。
4 创建PDF
创建pdf采用reportlab.首先pip3 install reportlab 安装 库。
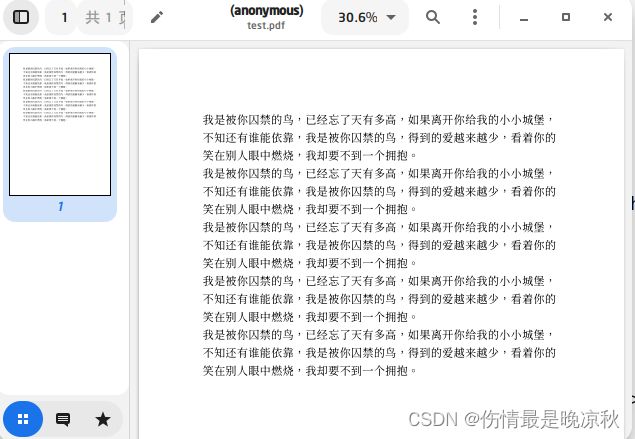
4.1 创建文本内容
使用reportlab创建中文时,需要进行字体注册,所以生成文档前请事先准备好中文字体。一个简单的示例:
# coding:utf-8

from reportlab.pdfbase import pdfmetrics
from reportlab.pdfbase.ttfonts import TTFont
from reportlab.lib.styles import ParagraphStyle
from reportlab.platypus import SimpleDocTemplate,Paragraph
from reportlab.lib.pagesizes import letter, A4


#字体注册,第一个参数可以自定义,第二个参数你准备好的字体文件。
pdfmetrics.registerFont(TTFont('yymt', 'yymt.ttf'))

#段落样式
style = ParagraphStyle(name='Normal', #标准样式
                       fontName='yymt', #注册的字体名称
                       fontSize=14, #字体大小
                       leading = 22, #行距
                       )

#准备文本内容
text = '我是被你囚禁的鸟,已经忘了天有多高,如果离开你给我的小小城堡,不知还有谁能依靠,我是被你囚禁的鸟,得到的爱越来越少,看着你的笑在别人眼中燃烧,我却要不到一个拥抱。'

#段落,第一个参数为内容,第二个参数是上面定义的段落样式
pg = Paragraph(text,style)

#创建文档,参数时文档保存位置,和页面大小
doc = SimpleDocTemplate("test.pdf",pagesize=A4)

#文档内容拼接,这里简单重复了5次上面的段落
content = []
for i in range(1,6):
    content.append(pg)

#生成文档,参数为一个列表,如果只有一个段落,也要定义成list
doc.build(content)
4.2 创建表格
Reportlab中表格对象的属性:
Table(
	data, # 单元格值
	colWidths=None, # 列宽
	rowHeights=None, # 行高
	style=None,	 # 样式
	splitByRow=1, #按行拆分表格,当前空间显示不下时是否按行拆分表格
	repeatRows=0, #表格拆分时重复的前导行
	repeatCols=0, #此参数会被忽略,因为目前无法按列拆分表格。
	rowSplitRange=None, #用于控制将表拆分为其行子集
	spaceBefore=None, #表前放置额外空间
	spaceAfter=None, #表后放置额外空间
)
一个简单的示例:
from reportlab.platypus.tables import Table, TableStyle
from reportlab.lib import colors
from reportlab.lib.units import inch
from reportlab.platypus import SimpleDocTemplate, Paragraph, Table, TableStyle
from reportlab.pdfbase import pdfmetrics
from reportlab.pdfbase.ttfonts import TTFont

#字体注册,第一个参数可以自定义,第二个参数你准备好的字体文件。
pdfmetrics.registerFont(TTFont('yymt', 'yymt.ttf'))

#内容列表
content = []
#表格数据
data = [
    ['测试表格', '', '', '', '', ''],
    ['标题1', '标题2', '标题3', '标题4', '标题5', '标题6'],
    ['11', '12', '13', '14', '15', '16'],
    ['21', '22', '23', '24', '25', '26'],
    ['31', '32', '33', '34', '35', '36']
]

#表格(不设置单元格宽高时,单元格宽高由内容自动撑开)
#table = Table(data)
#表格(单元格宽高设置)
table = Table(data,6*[inch],5*[0.3*inch])
#表格样式(参数是一个元组列表)
#每个元组的第一个元素是代表要设置的样式,后面两个元组是单元格范围,格式为(列,行)
style = TableStyle([
    #比如设置前两行文字颜色为橘色(从第一列第一个单元格,到最后一列第二个单元格)
    ('TEXTCOLOR',(0,0),(-1,1),colors.orange),
    #从第三行行文字颜色为灰色
    ('TEXTCOLOR',(0,2),(-1,-1),colors.grey),
    #最后一个单元格颜色为红色
    ('TEXTCOLOR',(-1,-1),(-1,-1),colors.red),
    #设置内边距
    ('INNERGRID', (0,0), (-1,-1), 0.25, colors.grey),
    #设置外边距
    ('BOX', (0,0), (-1,-1), 1, colors.pink),
    #前三行设置中文字体
    ("FONTNAME",(0,0), (-1,2), 'yymt'),
    #所有单元格内容居中
    ('ALIGN', (0,0), (-1,-1), 'CENTER'),
    #首行合并
    ('SPAN',(0,0),(-1,0))
    ])
#为表格添加定义好的表格样式
table.setStyle(style)

#将表格追加到内容列表中
content.append(table)
#生成文档
doc = SimpleDocTemplate('test1.pdf')
doc.build(content)
生成的表格如下:
 其中tableStyle 可设置的样式,来自官方文档的自动翻译,你们应该看得懂:
FONT -采用字体名称,可选字体大小和可选前导。
FONTNAME(或FACE) -采用字体名称。
FONTSIZE(或SIZE) -以点为 单位的字体大小
LEADING -以点为单位的字符间距
TEXTCOLOR -接受颜色名称或(R,G,B)元组。
ALIGNMENT (or ALIGN)-取左,右和中心(或中心)或十进制之一。
LEFTPADDING -接受一个整数,默认为6。
RIGHTPADDING -接受一个整数,默认为6。
BOTTOMPADDING -接受一个整数,默认为3。
TOPPADDING -接受一个整数,默认为3。
BACKGROUND -接受由对象、字符串名或数字元组/列表定义的颜色,或接受一个列表/元组,
描述所需的渐变填充包含三个表单元素[DIRECTION, startColor, endColor] 其中方向为垂直或水平。
rowbackground -获取一个要循环使用的颜色列表。
colbackground -获取一个要循环使用的颜色列表。
VALIGN -接受TOP, MIDDLE或默认BOTTOM中的一个
4.3 表单
4.3.1 复选框
from reportlab.pdfgen import canvas
from reportlab.pdfbase import pdfform
from reportlab.lib.colors import magenta, pink, blue, green
from reportlab.pdfbase import pdfmetrics
from reportlab.pdfbase.ttfonts import TTFont

#字体注册
pdfmetrics.registerFont(TTFont('yymt', 'yymt.ttf'))

#Canvas是reportlab绘制操作的接口
#需要注意的时canvas绘制时页面会被当作一张画布
#其原点座标(0,0)是在页面左下角.
c = canvas.Canvas('test2.pdf')

#定义标题
c.setFont("yymt", 20)
#绘制居中文本,前两个参数为座标
#表示在距离左边300,距离下部700,单位是点
#1毫米大概是2.8个点。
c.drawCentredString(300, 700, '爱好')

#表单:
form = c.acroForm

#复选框项
c.drawString(10, 650, '篮球')
#复选框1
form.checkbox(name='lq', tooltip='篮球',
              x=110, y=645, buttonStyle='check',
              borderColor=magenta, fillColor=pink,
              textColor=blue, forceBorder=False)
#复选框2
c.drawString(10, 600, '足球')
form.checkbox(name='zq', tooltip='足球',
              x=110, y=595, buttonStyle='cross',
              borderColor=magenta, fillColor=green,
              textColor=blue, forceBorder=True)
#复选框3
c.drawString(10, 550, '电影')
form.checkbox(name='zq', tooltip='电影',
              x=110, y=545, buttonStyle='circle',
              borderColor=magenta,
              textColor=blue, forceBorder=True)
c.save()
以下是checkbox可设置选项:
| 参数 | 说明 | 默认值 |
|---|---|---|
| name | 名称 | None |
| x | x坐标 | 0 |
| y | y坐标 | 0 |
| size | 轮廓尺寸大小(x大小) | 20 |
| checked | 是否选中 | False |
| buttonStyle | 按钮样式 | 'check' |
| shape | 阴影 | 'square' |
| fillColor | 填充色 | None |
| textColor | 文字颜色 | None |
| borderWidth | 边框宽度 | 1 |
| borderColor | 边框颜色 | None |
| borderStyle | 边框样式 | 'solid' |
| tooltip | 鼠标悬停提示 | None |
| annotationFlags | 注释标志的空白分隔字符串 | 'print' |
| fieldFlags | 空格分隔字段标志 | 'required' |
| forceBorder | 是否强制边界 | False |
| relative | 是否相对定位 | False |
| dashLen | 如果borderStyle=='dashed',则使用dashline | 3 |
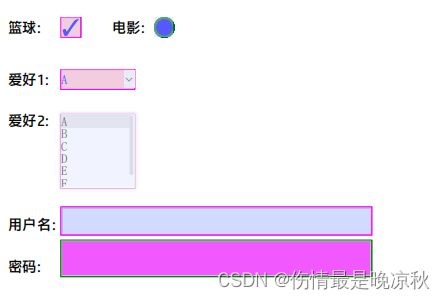
4.3.2 其它表单元素:
# coding: gbk

from reportlab.pdfgen import canvas
from reportlab.pdfbase import pdfform
from reportlab.lib.colors import magenta, pink, blue, green
from reportlab.pdfbase import pdfmetrics
from reportlab.pdfbase.ttfonts import TTFont

def form_example():
    c = canvas.Canvas('d:/example.pdf')

    pdfmetrics.registerFont(TTFont('st', 'hpsimplifiedhans-regular.ttf'))

    c.setFont("st", 14)
    form = c.acroForm

    #--------------------   单选按钮  -----------------------
    c.drawString(10, 650, '篮球:')
    form.radio(name='radio1', tooltip='Field radio1',
               value='value1', selected=False,
               x=60, y=645, buttonStyle='check',
               borderStyle='solid', shape='square',
               textColor=blue, forceBorder=True)
    form.radio(name='radio1', tooltip='Field radio1',
               value='value2', selected=True,
               x=60, y=645, buttonStyle='check',
               borderStyle='solid', shape='square',
               borderColor=magenta, fillColor=pink,
               textColor=blue, forceBorder=True)

    c.drawString(110, 650, '电影:')
    form.radio(name='radio2', tooltip='Field radio2',
               value='value1', selected=True,
               x=150, y=645, buttonStyle='cross',
               borderStyle='solid', shape='circle',
               borderColor=green, fillColor=blue,
               borderWidth=2,
               textColor=pink, forceBorder=True)
    form.radio(name='radio2', tooltip='Field radio2',
               value='value2', selected=False,
               x=150, y=645, buttonStyle='cross',
               borderStyle='solid', shape='circle',
               borderColor=green, fillColor=blue,
               borderWidth=2,
               textColor=pink, forceBorder=True)

    #-------------------- 下拉列表 -------------------
    c.setFont("st", 14)
    c.drawString(10, 600, '爱好1:')
    options = [('A','A'),'B',('C','C'),('D','D'),'E',('F',),('G','G')]
    form.choice(name='choice',
                tooltip='爱好',
                value='A',
                x=60,y=595, width=72, height=20,
                borderColor=magenta, fillColor=pink,
                textColor=blue, forceBorder=True, options=options)

    #-------------------- 列表框 -------------------
    c.drawString(10, 560, '爱好2:')
    options1 = [('A','A'),'B',('C','C'),('D','D'),'E',('F',),('G','G')]
    form.listbox(name='listbox1', value='A',
                x=60, y=500, width=72, height=72,
                borderColor=magenta, fillColor=pink,
                textColor=blue, forceBorder=True, options=options1,
                fieldFlags='multiSelect')

    #--------------------- 输入框 -------------------------
    c.drawString(10, 460, '用户名:')
    form.textfield(name='uname', tooltip='User Name',
                   x=60, y=455, borderStyle='inset',
                   borderColor=magenta,
                   width=300,height=28,
                   textColor=blue, forceBorder=True)

    c.drawString(10, 420, '密码:')
    form.textfield(name='upass', tooltip='Password',
                   x=60, y=415, borderStyle='inset',
                   borderColor=green, fillColor=magenta,
                   width=300,
                   textColor=blue, forceBorder=True)


    c.save()

if __name__ == '__main__':
    form_example()
结果如下:
4.4 图片
# coding: utf-8

from reportlab.platypus import SimpleDocTemplate,Image
def image_example():

    doc = SimpleDocTemplate("example.pdf")

    content = []

    img = Image("test.bmp",200,40)
    content.append(img)


    doc.build(content)
if __name__ == '__main__':
    image_example()
5 一个比较完整的例子
源代码及素材:
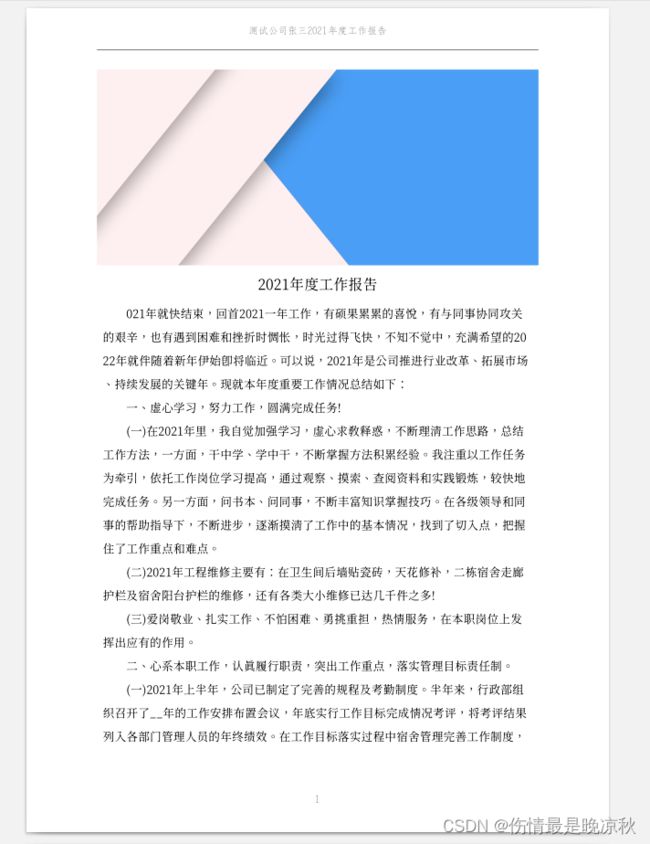
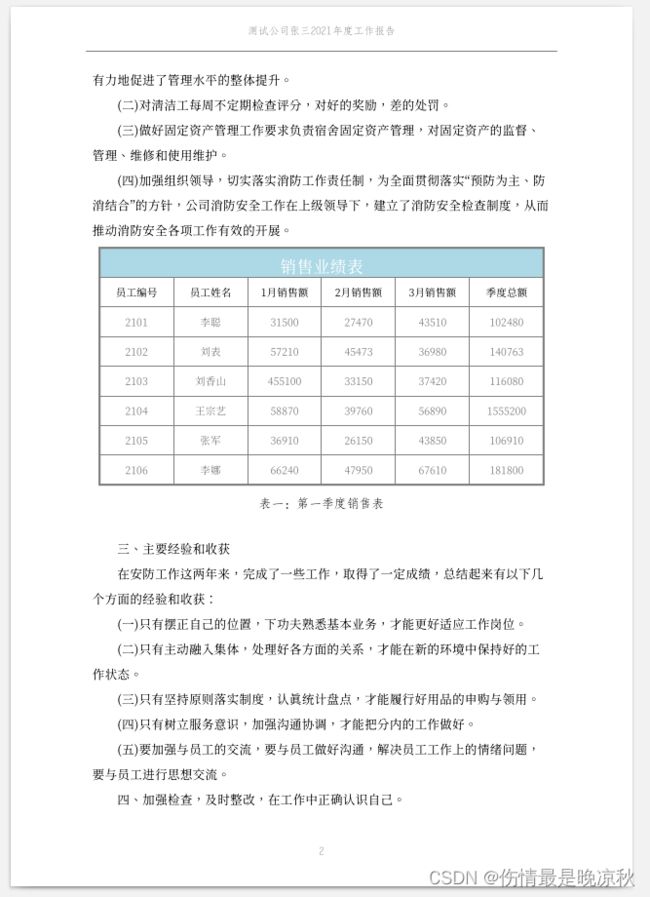
源码及素材https://gitcode.net/momo1938/python-pdf
下面是源码:
# coding:utf-8
from reportlab.lib.styles import getSampleStyleSheet #样式库
from reportlab.platypus import BaseDocTemplate, Frame, PageTemplate, Paragraph,Image
from reportlab.pdfbase import pdfmetrics #字体注册
from reportlab.pdfbase.ttfonts import TTFont #字体
from reportlab.lib.units import cm #尺寸
from reportlab.lib import colors # 颜色
from reportlab.lib.pagesizes import A4 #页面尺寸
from reportlab.pdfgen import canvas
from reportlab.platypus.tables import Table, TableStyle


#字体注册,注册两种字体为了方便不同形式的内容展示
#注意字体文件(ttf文件)一定要存在
pdfmetrics.registerFont(TTFont('yymt', 'yymt.ttf'))
pdfmetrics.registerFont(TTFont('fs', 'fs.ttf'))


#页眉页脚样式
def headerFooterStyle():
    styles = getSampleStyleSheet()
    styleN = styles['Normal']
    styleN.fontName = "fs" #
    styleN.fontSize = 10
    styleN.textColor = colors.gray
    styleN.alignment = 1 #居中

    return styleN

#标题样式
def titleStyle():
    styles = getSampleStyleSheet()
    styleN = styles['Normal']
    styleN.fontName = "yymt" # 字体
    styleN.fontSize = 15 # 字体大小
    styleN.alignment = 1 #居中,居左为0
    styleN.spaceBefore = 10 # 段前间距
    styleN.spaceAfter = 20 # 段后间距

    return styleN

#正文样式
def textStyle():
    styles = getSampleStyleSheet()
    styleN = styles['Normal']
    styleN.fontName = "yymt"
    styleN.fontSize = 12
    styleN.leading = 24 # 行距
    styleN.firstLineIndent = 24 #首行缩进2个字(fontSize的2倍)
    return styleN

#图例文字样式
def examStyle():
    styles = getSampleStyleSheet()
    styleN = styles['Normal']
    styleN.fontName = "fs"
    styleN.fontSize = 12
    styleN.leading = 24 # 行距
    styleN.alignment = 1
    styleN.spaceBefore = 10
    styleN.spaceAfter = 20

    return styleN

#表格样式
def tableStyle():
    style = TableStyle([
    ('TEXTCOLOR',(0,0),(-1,0),colors.white), #第一行文字颜色
    ('BACKGROUND', (0,0), (-1,0), colors.lightblue), #第一行背景色
    ('TEXTCOLOR',(0,2),(-1,-1),colors.grey),
    ('INNERGRID', (0,0), (-1,-1), 0.25, colors.grey), #内边框粗细和颜色
    ('BOX', (0,0), (-1,-1), 2, colors.gray), #外边框粗细和颜色
    ("FONTNAME",(0,0), (-1,-1), 'yymt'), #所有单元格设置中文字体
    ('ALIGN', (0,0), (-1,-1), 'CENTER'), #水平居中所有单元格
    ('VALIGN', (0,0), (-1,-1), 'MIDDLE'), #垂直居中所有单元格
    ('SPAN',(0,0),(-1,0)),#第一行合并单元格
    ('FONTSIZE',(0,0),(-1,0),16)#第一行文字大小
    ])

    return style

# 页脚(这里页脚只有页码)
def footer(canvas, doc):
    canvas.saveState()
    pageNumber = ("%s" %canvas.getPageNumber())
    p = Paragraph(pageNumber, headerFooterStyle())
    w, h = p.wrap(doc.width, doc.bottomMargin)

    #-1cm的目的是为了让页码在2cm的下边距里上下居中
    p.drawOn(canvas,doc.leftMargin,doc.bottomMargin-1*cm)
    canvas.restoreState()

#页眉
def header(canvas, doc):
    canvas.saveState()
    p = Paragraph("测试公司张三2021年度工作报告", headerFooterStyle())
    w,h = p.wrap(doc.width, doc.topMargin)
    p.drawOn(canvas, doc.leftMargin, doc.bottomMargin+ doc.height + 1*cm)
    canvas.setStrokeColor(colors.gray)
    #画线(页眉底部的横线)
    canvas.line(doc.leftMargin, doc.bottomMargin+doc.height + 0.5*cm, doc.leftMargin+doc.width, doc.bottomMargin+doc.height + 0.5*cm)
    canvas.restoreState()

if __name__ == '__main__':
    #文档属性,保存路径,页面大小和页边距
    doc = BaseDocTemplate("e11.pdf", pagesize = A4,topMargin = 2*cm, bottomMargin = 2*cm)
    #内容区域
    frame= Frame(doc.leftMargin, doc.bottomMargin, doc.width, doc.height, id='normal')
    #页面模板
    template = PageTemplate(id='e11', frames=frame, onPage=header, onPageEnd=footer)
    doc.addPageTemplates([template])

    #页首图片
    img = Image("top.jpg")
    img.drawWidth = doc.width
    img.drawHeight = 200

    #标题
    title = Paragraph("2021年度工作报告", titleStyle())

    content = []
    content.append(img)
    content.append(title)

    #正文(从文本文件中读取一段文字)
    file1 = open('text1.txt','r')
    file_text = file1.read()
    ps = file_text.split("\n")
    for p in ps:
        text = Paragraph(p, textStyle())
        content.append(text)
    file1.close()

    #表格
    table_data = [
        ['销售业绩表', '', '', '', '', ''],
        ['员工编号', '员工姓名', '1月销售额', '2月销售额', '3月销售额', '季度总额'],
        ['2101', '李聪', '31500', '27470', '43510', '102480'],
        ['2102', '刘表', '57210', '45473', '36980', '140763'],
        ['2103', '刘香山', '455100', '33150', '37420', '116080'],
        ['2104', '王宗艺', '58870', '39760', '56890', '1555200'],
        ['2105', '张军', '36910', '26150', '43850', '106910'],
        ['2106', '李娜', '66240', '47950', '67610', '181800'],

    ]
    table = Table(table_data,6*[2.5*cm],8*[1*cm])
    table.setStyle(tableStyle())
    content.append(table)

    #添加一个表格的说明:
    exam1 = Paragraph("表一:第一季度销售表", examStyle())
    content.append(exam1)

    #再次读入一段文字
    file2 = open('text2.txt','r')
    file_text2 = file2.read()
    ps2 = file_text2.split("\n")
    for p in ps2:
        text = Paragraph(p, textStyle())
        content.append(text)
    file2.close()

    doc.build(content)
生成的文档预览:


