配置图例
import numpy as np
import matplotlib.pyplot as plt
%matplotlib inline
plt.style.use('classic')
x=np.linspace(0,10,100)
fig,ax=plt.subplots()
ax.plot(x,np.sin(x),'-b',label='Sine')
ax.plot(x,np.cos(x),'--g',label='Cosine')
ax.axis=('equal')
leg=ax.legend()
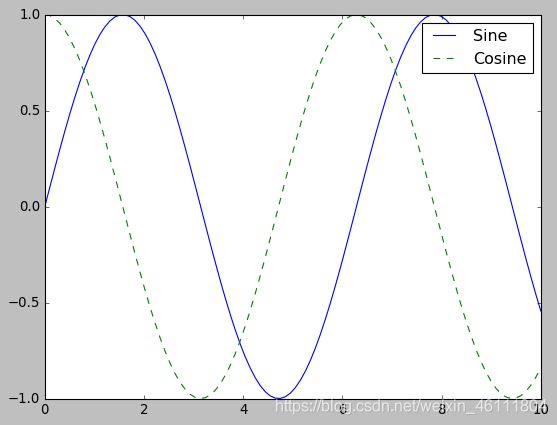
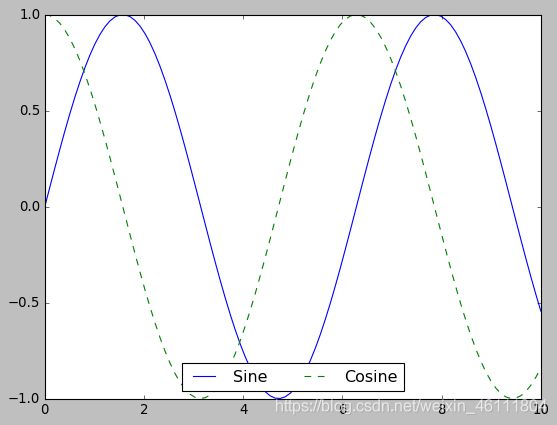
ax.legend(loc='lower center',frameon=True,ncol=2)
fig
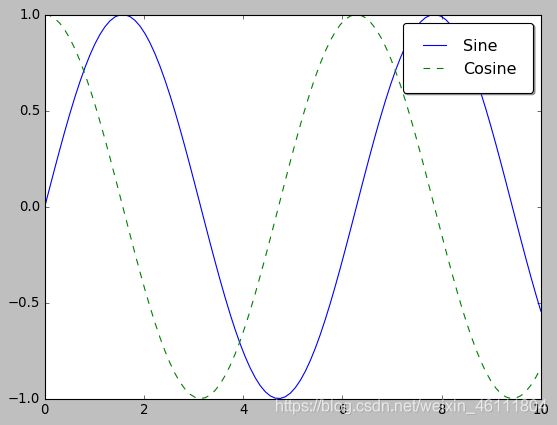
ax.legend(fancybox=True,framealpha=1,shadow=True,borderpad=1)
fig
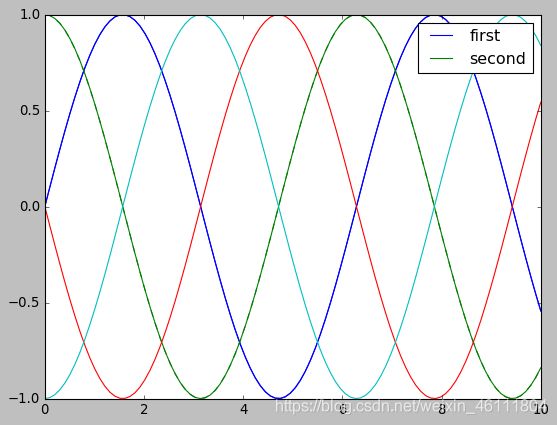
y=np.sin(x[:,np.newaxis]+np.pi*np.arange(0,2,0.5))
lines=ax.plot(x,y)
ax.legend(lines[:2],['first','second'])
fig
import pandas as pd
cities=pd.read_csv('H:\data\california_cities.csv')
lat,lon=cities['latd'],cities['longd']
population, area = cities['population_total'], cities['area_total_km2']
plt.scatter(lon, lat, label=None,
c=np.log10(population), cmap='viridis',
s=area, linewidth=0, alpha=0.5)
plt.axis(aspect='equal')
plt.xlabel('longitude')
plt.ylabel('latitude')
plt.colorbar(label='log$_{10}$(population)')
plt.clim(3, 7)
for area in [100,300,500]:
plt.scatter([],[],c='k',s=area,
alpha=0.3,label=str(area)+'km$^2$')
plt.legend(
scatterpoints=1,
frameon=True,
fancybox=True,
labelspacing=1,
columnspacing=3,
ncol=1,
handlelength=1,
handletextpad=1,
borderpad=1,
borderaxespad=1,
markerfirst=False,
markerscale=1,
title='City Area',
title_fontsize=15,
facecolor='b',
edgecolor='r',
shadow=True,
scatteryoffsets=[0.5,0.5,0.5],
)
plt.title('California Cities:Area and Population')
Text(0.5, 1.0, 'California Cities:Area and Population')

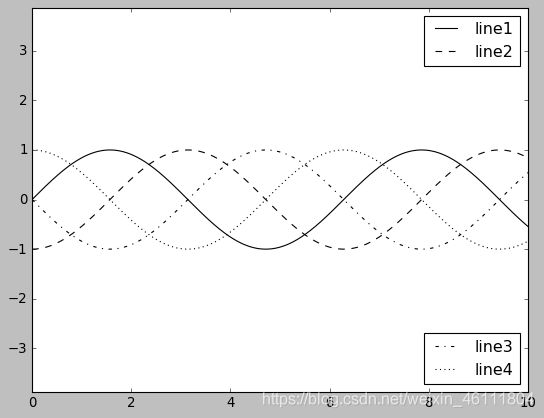
fig,ax=plt.subplots()
lines=[]
style=['-','--','-.',':']
x=np.linspace(0,10,1000)
for i in range(4):
lines+=ax.plot(x,np.sin(x-i*np.pi/2),style[i],color='k')
ax.axis('equal')
ax.legend(lines[:2],['line1','line2'],loc='upper right',frameon=True)
from matplotlib.legend import Legend
leg=Legend(ax,lines[2:],['line3','line4'],loc='lower right',frameon=True)
ax.add_artist(leg)
配色方案
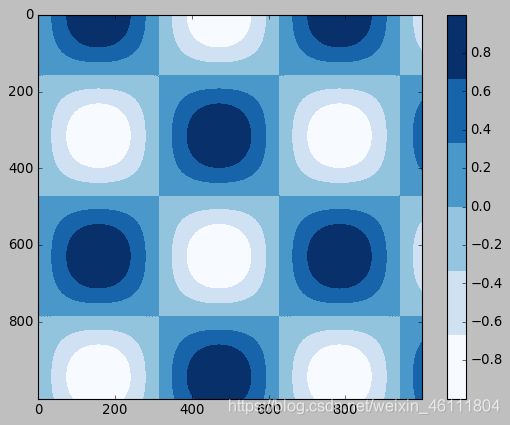
x=np.linspace(0,10,1000)
img=np.sin(x)*np.cos(x[:,np.newaxis])
plt.imshow(img,cmap=plt.cm.get_cmap('Blues',6))
plt.colorbar()
- 顺序配色方案
由一组连续的颜色构成的配色方案(例如 binary 或 viridis)。
- 互逆配色方案
通常由两种互补的颜色构成,表示正反两种含义(例如 RdBu 或 PuOr)。
- 定性配色方案
随机顺序的一组颜色(例如 rainbow 或 jet)。
定性配色方案在亮度较高时,颜色难以分辨,同时,重点容易被灰度较亮的那部分影响,视觉效果不佳。
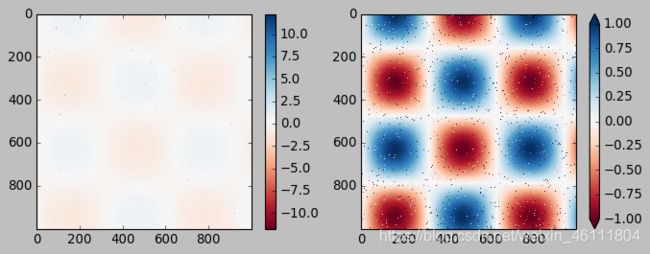
speckles = np.random.random(img.shape) < 0.01
img[speckles] = np.random.normal(0, 3, np.count_nonzero(speckles))
plt.figure(figsize=(10, 3.5))
plt.subplot(1, 2, 1)
plt.imshow(img, cmap='RdBu')
plt.colorbar()
plt.subplot(1, 2, 2)
plt.imshow(img, cmap='RdBu')
plt.colorbar(extend='both')
plt.clim(-1, 1)
