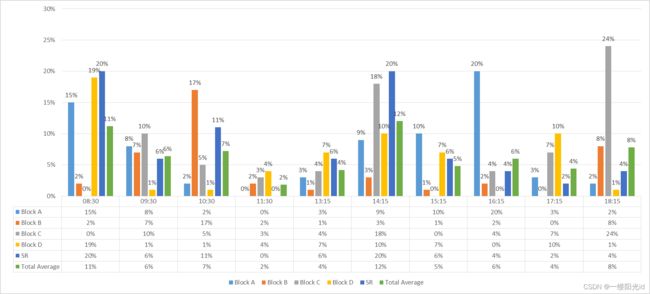
使用ECharts制作柱形图
1.下载ECharts
npm install echarts --save
2.在main.ts引入 ECharts
import 'element-ui/lib/theme-chalk/index.css'
import * as echarts from 'echarts' //引入echarts
Vue.prototype.$echarts = echarts //注册组件
3.在主页面先放一个div大盒子,设置宽高
4.在主页面引入
import * as echarts from 'echarts' //引入echarts文件
export default {
	mounted() {
		this.columnar(); //挂载后调用方法
	},
	methods: {
		columnar() {
			//获取id对象
			let columnar = echarts.init(document.getElementById('columnar'));
			//开始绘制
			columnar.setOption({
				// 调整图表容器距离底部的距离,给表格腾空间
				grid: {
					bottom: 200
				},
				// 图例调整位置,对应表格的相应行
				legend: [
					//侧边图例
					{
						data: ['Block A', 'Block B', 'Block C', 'Block D', 'SR', 'Total Average'],
						bottom: 30,
						left: 20,
						orient: 'vertical',
						itemGap: 10
					},
					//底部图例
					{
						data: ['Block A', 'Block B', 'Block C', 'Block D', 'SR', 'Total Average'],
						bottom: 0,
						itemGap: 5
					}],
				//柱形图显示的数据
				dataset: {
					dimensions: ['product', 'Block A', 'Block B', 'Block C', 'Block D', 'SR', 'Total Average'],
					source: [
						{ product: '08:30', 'Block A': 15, 'Block B': 2, 'Block C': 0, 'Block D': 19, 'SR': 20, 'Total Average': 11 },
						{ product: '09:30', 'Block A': 8, 'Block B': 7, 'Block C': 10, 'Block D': 1, 'SR': 6, 'Total Average': 6 },
						{ product: '10:30', 'Block A': 2, 'Block B': 17, 'Block C': 5, 'Block D': 1, 'SR': 11, 'Total Average': 7 },
						{ product: '11:30', 'Block A': 0, 'Block B': 2, 'Block C': 3, 'Block D': 4, 'SR': 0, 'Total Average': 2 },
						{ product: '13:15', 'Block A': 3, 'Block B': 1, 'Block C': 4, 'Block D': 7, 'SR': 6, 'Total Average': 4 },
						{ product: '14:15', 'Block A': 9, 'Block B': 3, 'Block C': 18, 'Block D': 10, 'SR': 20, 'Total Average': 12 },
						{ product: '15:15', 'Block A': 10, 'Block B': 1, 'Block C': 0, 'Block D': 7, 'SR': 6, 'Total Average': 5 },
						{ product: '16:15', 'Block A': 20, 'Block B': 2, 'Block C': 4, 'Block D': 0, 'SR': 4, 'Total Average': 6 },
						{ product: '17:15', 'Block A': 3, 'Block B': 0, 'Block C': 7, 'Block D': 10, 'SR': 2, 'Total Average': 4 },
						{ product: '18:15', 'Block A': 2, 'Block B': 8, 'Block C': 24, 'Block D': 1, 'SR': 4, 'Total Average': 8 }
					]
				},
				xAxis: [
					{
						type: 'category' //显示柱形图
					},
					{
						position: 'bottom', //将坐标轴定位到底部
						data: ['08:30', '09:30', '10:30', '11:30', '13:15', '14:15', '15:15', '16:15', '17:15', '18:15'],
						axisTick: {
							length: 165, // 延长坐标轴刻度的长度,用作表格竖线
						}
					},
					{ //1
						data: ['15%', '8%', '2%', '0%', '3%', '9%', '10%', '20%', '3%', '2%'],
						position: 'bottom', // 将坐标轴定位到底部
						offset: 25, // 设置位置偏移
						axisTick: {
							show: false,
						}
					},
					{ //2
						data: ['2%', '7%', '17%', '2%', '1%', '3%', '1%', '2%', '0%', '8%'],
						position: 'bottom',
						offset: 50,
						axisTick: {
							show: false,
						}
					},
					{ //3
						data: ['0%', '10%', '5%', '3%', '4%', '18%', '0%', '4%', '7%', '24%'],
						position: 'bottom',
						offset: 70,
						axisTick: {
							show: false,
						}
					},
					{ //4
						data: ['19%', '1%', '1%', '4%', '7%', '10%', '7%', '7%', '0%', '10%'],
						position: 'bottom',
						offset: 95,
						axisTick: {
							show: false,
						}
					},
					{ //5
						data: ['20%', '6%', '11%', '0%', '6%', '20%', '6%', '4%', '2%', '4%'],
						position: 'bottom',
						offset: 120,
						axisTick: {
							show: false,
						}
					},
					{ //6
						data: ['11%', '6%', '7%', '2%', '4%', '12%', '5%', '6%', '4%', '8%'],
						position: 'bottom',
						offset: 145,
						axisTick: {
							show: false,
						}
					},
					{// 最后加一个无data的项,作为表格最底部的线
						position: 'bottom',
						offset: 165,
						axisTick: {
							show: false,
						}
					}
				],
				yAxis: {
					axisLabel: {
						formatter: '{value} %' //y轴数据转化成百分比形式
					}
				},
				//bar表示柱形图,barWidth表示柱形图宽度,position柱形图数据显示的位置
				series: [
					{
						type: 'bar',
						itemStyle: {
							normal: {
								label: {
									show: true, //开启显示
									position: 'top',
									formatter: '{@1}%' //柱形图上显示数据百分比
								}
							}
						}
					},
					{
						type: 'bar',
						itemStyle: {
							normal: {
								label: {
									show: true,
									position: 'top',
									formatter: '{@2}%'
								}
							}
						}
					},
					{
						type: 'bar',
						itemStyle: {
							normal: {
								label: {
									show: true,
									position: 'top',
									formatter: '{@3}%'
								}
							}
						}
					},
					{
						type: 'bar',
						itemStyle: {
							normal: {
								label: {
									show: true,
									position: 'top',
									formatter: '{@4}%'
								}
							}
						}
					},
					{
						type: 'bar',
						itemStyle: {
							normal: {
								label: {
									show: true,
									position: 'top',
									formatter: '{@5}%'
								}
							}
						}
					},
					{
						type: 'bar',
						itemStyle: {
							normal: {
								label: {
									show: true,
									position: 'top',
									formatter: '{@6}%'
								}
							}
						}
					}
				],
				//悬停显示柱形数据
				tooltip: {
					trigger: 'axis',
					axisPointer: {
						type: 'shadow'
					}
				}
			})
		}
	}
}
效果图
