python画图怎么改变lable的位置
问题描述:
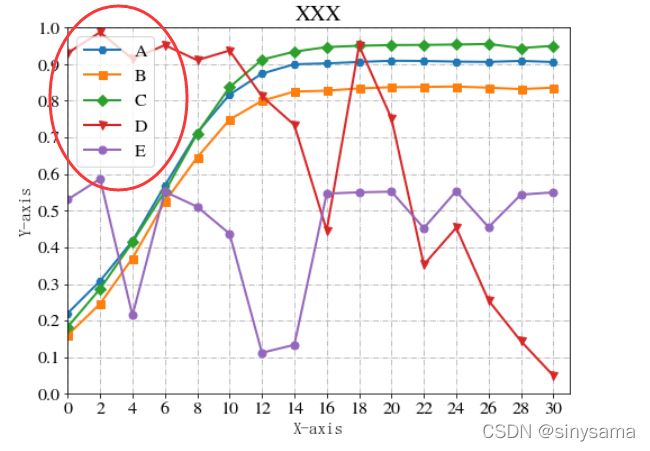
当画中的线密集到覆盖整个画板,标注的lable就会和图片重叠。这很影响美观。
因此,我们可以将下图圈中部分移到区域外部。
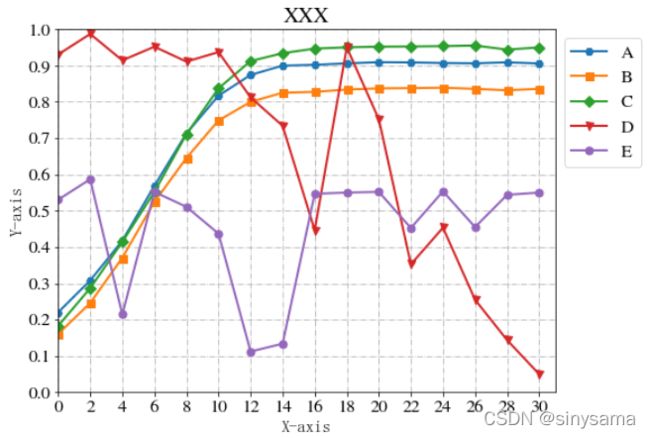
效果如下:可以看到,label本身和图片不再重叠,在线多的情况下这种方式最为实用。
实现方式
在图例中使用
plt.legend(loc='upper left', bbox_to_anchor=(1, 1))
此外,loc还有其他位置表示方式
| loc参数 |
|---|
| upper right |
| upper left |
| lower left |
| lower right |
| right |
| center left |
| center right |
| lower center |
| upper center |
| center |
完整代码
from matplotlib import pyplot
import matplotlib.pyplot as plt
from matplotlib.font_manager import FontProperties
from matplotlib.ticker import MultipleLocator, FormatStrFormatter
font_set = FontProperties(fname=r"c:\windows\fonts\simsun.ttc", size=15)
import matplotlib
import numpy as np
from mpl_toolkits.axes_grid1.inset_locator import inset_axes
from mpl_toolkits.axes_grid1.inset_locator import mark_inset
from matplotlib.patches import ConnectionPatch
%matplotlib inline

plt.rcParams['figure.figsize'] = (8.0, 6.0) # set default size of plots
plt.rcParams['image.interpolation'] = 'nearest'
plt.rcParams['image.cmap'] = 'gray'
plt.rcParams['font.sans-serif']=['SimHei']
plt.rcParams['axes.unicode_minus']=False
# 设置标题大小
plt.rcParams['font.size'] = '16'
#解决画多幅图时出现图形部分重叠
fig = plt.figure()
matplotlib.rcParams.update(
{
'text.usetex': False,
'font.family': 'stixgeneral',
'mathtext.fontset': 'stix',
}
)
myfont = FontProperties(fname='/home/linuxidc/.local/share/fonts/文泉驿正黑.ttf')

#准备数据
x = range(0,31,2)

A=[0.2204262385828951,0.30839304560351055,0.4176158354528364,0.5689115113547377,0.7132088021728286,0.8170438670019559,0.874248496993988,0.8998229892687244,0.9022254048694502,0.9059819476369345,0.9094392004441977,0.9087585175336547,0.9070491438736936,0.9061997894620201,0.9090201312423535,0.905820399113082]
B=[0.16086354829781346,0.24623673832139087,0.37067344907663385,0.5243875153820338,0.6455296269608115,0.7488125174629785,0.8000445335114674,0.8252572187188848,0.8275862068965517,0.8340528115714526,0.8372015546918379,0.837903717245582,0.8390037802979764,0.8358911851072082,0.8319986653319986,0.8359756097560975]
C=[0.18306116800442845,0.2870632672332389,0.4144089350879133,0.5520192415258978,0.7109362008757829,0.8372170997485331,0.9124159429971054,0.9341066489655936,0.946792993279718,0.9503133935078769,0.9521488062187674,0.952635311063099,0.9535668223259951,0.9552372984652889,0.9439895451006562,0.9501552106430155]
D=[0.9306116800442845,0.9870632672332389,0.9144089350879133,0.9520192415258978,0.9109362008757829,0.9372170997485331,0.8124159429971054,0.7341066489655936,0.446792993279718,0.9503133935078769,0.7521488062187674,0.352635311063099,0.4535668223259951,0.2552372984652889,0.1439895451006562,0.0501552106430155]
E=[0.5306116800442845,0.5870632672332389,0.2144089350879133,0.5520192415258978,0.5109362008757829,0.4372170997485331,0.1124159429971054,0.1341066489655936,0.546792993279718,0.5503133935078769,0.5521488062187674,0.452635311063099,0.5535668223259951,0.4552372984652889,0.5439895451006562,0.5501552106430155]


#绘图
fig, ax = plt.subplots(1, 1)

ax.plot(x, A, marker='H',linewidth=2,markersize=7,label=u'A')
ax.plot(x, B, marker='s',linewidth=2,markersize=7,label=u'B')
ax.plot(x, C, marker='D',linewidth=2,markersize=7,label=u'C')
ax.plot(x, D, marker='v',linewidth=2,markersize=7,label=u'D')
ax.plot(x, E, marker='o',linewidth=2,markersize=7,label=u'E')
plt.grid(linestyle='-.')
plt.grid(True)
y_major_locator=MultipleLocator(0.1)
x_major_locator=MultipleLocator(2)
ax=plt.gca()
ax.xaxis.set_major_locator(x_major_locator)
ax.yaxis.set_major_locator(y_major_locator)
plt.ylim(0,1.0)
plt.xlim(0,31)

plt.legend(loc='upper left', bbox_to_anchor=(1, 1))
plt.title('XXX')
plt.xlabel('X-axis',fontproperties=font_set) #X轴标签
plt.ylabel("Y-axis",fontproperties=font_set) #Y轴标签

plt.grid(linestyle='-.')

plt.show()