js绘图
文章目录
- JavaScript绘图
-
- 使用canvas
- 绘制图形
-
- 矩形
- 路径
- 圆弧
- 直线与曲线
- 定义样式和颜色
-
- 颜色
- 不透明度
- 实线
- 虚线
- 经向渐变
- 图案
- 阴影
- 填充规则
- 图形变形
-
- 保存和恢复状态
- 清除画布
- 移动坐标
- 旋转坐标
- 缩放图形
- 变换图形
- 图形合成
-
- 合成
- 裁切
- 绘制文本
-
- 填充文字
- 轮廓文字
- 文本样式
-
- 测量宽度
- 导入图像
- 缩放图像
- 裁切图像
- 平铺图像
JavaScript绘图
HTML5新增了Canvas API,允许js在标签识别的画布上绘制图形,创建动画,设置设计实时视频处理或渲染。借助一套编程接口,用户可以在页面上绘制出任何漂亮的图形。
【学习重点】
- 使用canvas元素。
- 绘制图形。
- 设置图形样式。
- 灵活使用Canvas API设计网页动画。
使用canvas
在HTML5文档中,使用标签可以在网页中创建一块画布。用法如下:
<canvas id="muCanvas" width="200" height="100">canvas>
该标签包括三个属性:
- id:用来标识画布,以方便js脚本对其引用。
- width:设置canvas的宽度。
- height:设置canvas的高度。
注意:与。如果结束标签不存在,则文档的其余部分会被认为是替代内容,将不会显示出来。
- 【实例1】可以使用CSS控制canvas的外观。
<canvas id="muCanvas" style="border:1px solid;" width="200" height="100">canvas>
使用js可以在canvas画布内绘画,或者设置动画。
【操作步骤】
- 第一步,在HTML页面中添加
标签,设置canvas的id属性值以便js调用。
<canvas id="myCanvas" width="200" height="100">
- 第二步,在js脚本中使用document.getELementById()方法,根据canvas元素的id获取对canvas的应用。
var c = document.getElementById("myCanvas");
- 第三步,通过canvas元素的getContext()方法获取画布上下文(context),创建context对象,以获取允许进行绘制的2D环境。
var context = c.getContext("2d");
getContext(“2d”)方法返回一个画布渲染上下文对象,使用该对象可以在canvas元素中绘制图形,参数2d表示二维绘图。
- 第四步,使用js进行绘制。
context.fillStyle = "pink";
context.fillRect(50, 25, 100, 50);
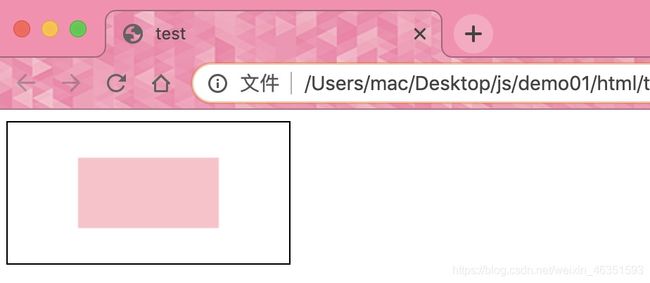
这两行代码中,fillStyle属性定义将要绘制的矩形的填充颜色为粉色,fillRect()方法制定了要绘制的矩形的位置和尺寸。图形的位置由前面的canvas坐标值决定,尺寸由后面的宽度和高度值决定。完整代码:
<script>
    window.onload = function() {
        var c = document.getElementById("myCanvas");
        var context = c.getContext("2d");
        context.fillStyle = "pink";
        context.fillRect(50, 25, 100, 50);
    }
script>

<body>
    <canvas id="myCanvas" style="border: 1px solid;" width="200" height="100">canvas>
body>
fillRect(50, 25, 100, 50)方法可以用来绘制矩形图形,它的前两个参数用于绘制图形的x轴和y轴坐标,后面两个参数设置绘制矩形的宽度和高度。
绘制图形
本节将介绍一些基本图形的绘制,包括矩形、直线、圆形、曲线等形状或路径。
矩形
canvas提供了3种方法绘制矩形。
- fillRect(x, y, width, height):绘制一个填充的矩形。
- strokeRect(x, y, width, height):绘制一个矩形的边框。
- clearRect(x, y, width, height):清除指定矩形区域,让清除部分完全透明。
参数说明:
- x:矩形左上角的x坐标。
- y:矩形左上角的y坐标。
- width:矩形的宽度,以像素为单位。
- height:矩形的高度,以像素为单位。
- 【实例】下面实例分别使用上面三种方法。
<script>
    window.onload = function() {
        draw();

        function draw() {
            var canvas = document.getElementById("canvas");
            if (canvas.getContext) {
                var ctx = canvas.getContext('2d');
                ctx.fillRect(25, 25, 100, 100);
                ctx.clearRect(45, 45, 60, 60);
                ctx.strokeRect(50, 50, 50, 50);
            }
        }
    }
script>

<body>
    <canvas id="canvas" style="border: 1px solid #999;" width="300" height="200">canvas>
body>
路径
使用路径绘制图形的步骤如下:
第一步,创建路径起始点。
第二布,使用画图命令绘制路径。
第三步,封闭路径。
第四步,生成路径之后,可以通过描边或填充路径区域来渲染图形。
需要调用的方法说明如下:
- beginPath():开始路径。
- closePath():闭合路径。闭合路径之后图形绘制命令又重新指向上下文。
- stroke():描边路径。通过线条来绘制图形轮廓。
- fill():填充路径。通过填充路径的内容区域生成实心的图形。
- 提示:生成路径的第一步是调用beginPath()方法。每次调用这个方法之后,表示开始重新绘制新的图形。闭合路径closePath()方法不是必需的;当调用fill()方法时,所有没有闭合的形状都会自动闭合,所以不需要调用closePath()方法;但是调用stroke()方法时不会自动闭合。
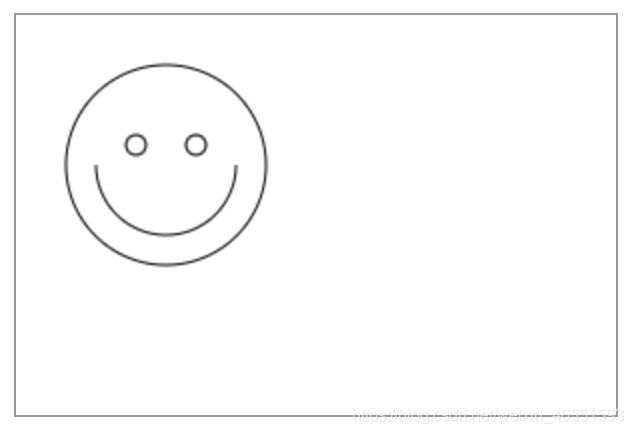
- 【实例】下面实例演示绘制一个笑脸。
<script>
    window.onload = function() {
        draw();

        function draw() {
            var canvas = document.getElementById("canvas");
            if (canvas.getContext) {
                var ctx = canvas.getContext('2d');
                ctx.beginPath();
                ctx.arc(75, 75, 50, 0, Math.PI * 2, true);
                ctx.moveTo(110, 75);
                ctx.arc(75, 75, 35, 0, Math.PI, false);
                ctx.moveTo(65, 65);
                ctx.arc(60, 65, 5, 0, Math.PI * 2, true);
                ctx.moveTo(95, 65);
                ctx.arc(90, 65, 5, 0, Math.PI * 2, true);
                ctx.stroke();


            }
        }
    }
</script>

<body>
    <canvas id="canvas" style="border: 1px solid #999;" width="300" height="200"></canvas>
</body>
上面代码中使用arc()方法,调用它可以绘制圆形,接下来详细讲解。
圆弧
使用arc()方法可以绘制弧或者圆。用法如下:
context.arc(x,y,r,sAngle,eAngle,counterclockwise);
参数说明:
- x:圆心的x坐标。
- y:圆心的y坐标。
- r:圆的半径。
- sAngle:起始角,以弧度计。提示,弧的圆形的三点钟位置是0度。
- eAngle:结束角,以弧度计。
- counterclockwise:可选参数,定义绘图方法。false为顺时针,为默认值;true为逆时针。
如果使用arc()创建圆,可以把起始点设置为0,结束角设置为2*Math.PI。
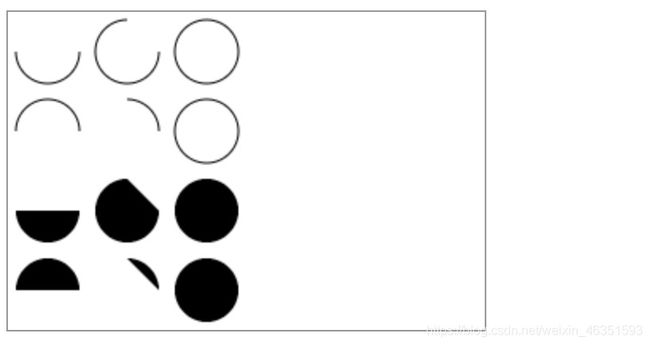
- 【实例】下面实例绘制了12个不同的角度以及填充的圆弧。主要使用两个for循环,生成圆弧的行列坐标。每一段圆弧的开始都调用beginPath()方法。代码中,每个圆弧的参数都是可变的,(x,y)坐标是可变的,半径(radius)和开始角(startAngle)都是固定的。结束角度(endAngle)在第一列开始时是180度(半圆),然后每列增加90度。最后一列形成一个完整的圆。
<script>
    window.onload = function() {
        draw();

        function draw() {
            var canvas = document.getElementById("canvas");
            if (canvas.getContext) {
                var ctx = canvas.getContext("2d");
                for (var i = 0; i < 4; i++) {
                    for (var j = 0; j < 3; j++) {
                        ctx.beginPath();
                        var x = 25 + j * 50;
                        var y = 25 + i * 50;
                        var radius = 20;
                        var startAngle = 0;
                        var endAngle = Math.PI + (Math.PI * j) / 2;
                        var anticlockwise = i % 2 == 0 ? false : true;
                        ctx.arc(x, y, radius, startAngle, endAngle, anticlockwise);
                        if (i > 1) {
                            ctx.fill();
                        } else {
                            ctx.stroke();
                        }
                    }
                }
            }
        }
    }
script>

<body>
    <canvas id="canvas" style="border: 1px solid #999;" width="300" height="200">canvas>
body>
直线与曲线
使用lineTo()方法可以绘制直线。用法如下:
lineTo(x,y)
参数x和y分别表示终点位置的x坐标和y坐标。lineTo(x, y)将绘制一条从当前位置到指定(x, y)位置的直线。
- 【实例1】下面实例绘制两个三角形,一个是填充的,另一个是描边的。
<script>
    window.onload = function() {
        draw();

        function draw() {
            var canvas = document.getElementById("canvas");
            if (canvas.getContext) {
                var ctx = canvas.getContext('2d');
                ctx.beginPath();
                ctx.moveTo(25, 25);
                ctx.lineTo(105, 25);
                ctx.lineTo(25, 105);
                ctx.fill();
                ctx.beginPath();
                ctx.moveTo(125, 125);
                ctx.lineTo(125, 45);
                ctx.lineTo(45, 125);
                ctx.closePath();
                ctx.stroke();
            }
        }
    }
script>

<body>
    <canvas id="canvas" style="border: 1px solid #999;" width="300" height="200">canvas>
body>
在上面实例代码中,从调用beginPath()方法准备绘制一个新的形状路径开始,使用movePath()方法移动到目标位置,两条线段绘制后构成三角形的两条边。当路径使用填充(fill)时路径会自动闭合。而使用描边(stroke)命令时则不会自动闭合路径。如果没有添加闭合路径closePath()到描边三角形中,则只绘制两条线段,并不是一个完整的三角形。
- 使用arcTo()方法可以绘制曲线,该方法时lineTo()的曲线版,它能够创建两条切线之间的弧或曲线。用法如下:
context.arcTo(x1, y1, x2, y2, r);
参数说明:
- x1:弧的起点x坐标。
- y1:弧的起点y坐标。
- x2:弧的终点x坐标。
- y2:弧的终点y坐标。
- r:弧的半径。
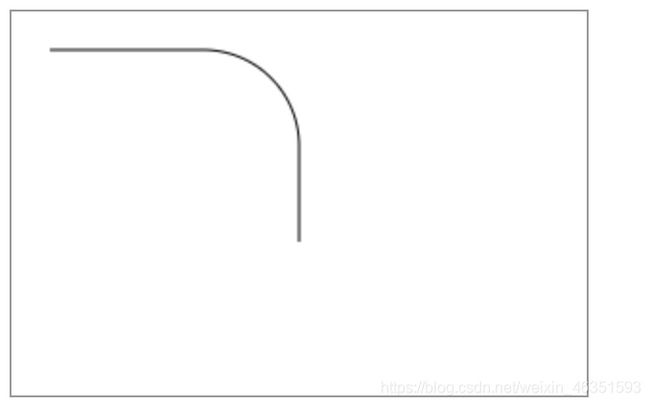
- 【实例2】本实例用lineTo()和arcTo()方法绘制直线和曲线,再连成圆角弧线。
<script>
    window.onload = function() {
        draw();

        function draw() {
            var canvas = document.getElementById("canvas");
            if (canvas.getContext) {
                var ctx = canvas.getContext('2d');
                ctx.beginPath();
                ctx.moveTo(20, 20);
                ctx.lineTo(100, 20);
                ctx.arcTo(150, 20, 150, 70, 50);
                ctx.lineTo(150, 120);
                ctx.stroke();
            }
        }
    }
script>

<body>
    <canvas id="canvas" style="border: 1px solid #999;" width="300" height="200">canvas>
body>
定义样式和颜色
canvas支持颜色和样式选项,如线性、渐变、图案、透明度和阴影。
颜色
使用fillStyle和strokeStyle属性可以给图形上色。其中,fillStyle设置图形的填充颜色,strokeStyle设置图形轮廓的颜色。
颜色值可以是表示CSS颜色值的字符串,那么这个新值机会成为新绘制的图形的默认值。如果要给每个图形定义不同的颜色,就需要重新设置fillStyle或strokeStyle的值。
- 【实例1】本实例嵌套for循环绘制方阵列表,每个方格填充不同颜色。
<script>
    window.onload = function() {
        draw();

        function draw() {
            var canvas = document.getElementById("canvas");
            if (canvas.getContext) {
                var ctx = canvas.getContext('2d');
                for (var i = 0; i < 6; i++) {
                    for (var j = 0; j < 6; j++) {
                        ctx.fillStyle = 'rgb(' + Math.floor(255 - 42.5 * i) + ',' + Math.floor(255 - 42.5 * j) + ', 0)';
                        ctx.fillRect(j * 25, i * 25, 25, 25);
                    }
                }
            }
        }
    }
</script>

<body>
    <canvas id="canvas" style="border: 1px solid #999;" width="300" height="200"></canvas>
</body>
在嵌套for结构中,使用变量i和j为每一个方格产生唯一的RGB色彩值,其中仅修改红绿色通道的值,保持蓝色通道的值不变。
不透明度
使用globalAlpha全局属性可以设置绘制图形的不透明度,另外也可以通过色彩的不透明度参数来为图形设置不透明度。相对与使用globalAlpha属性来说,这种方法更灵活些。使用rgba(R, G, B, A)方法可以设置具有不透明度的颜色。
rgba(R, G, B, A)
其中R、G、B将颜色的红色、绿色和蓝色分别指定为0~255之间的十进制整数;A把alpha(不透明)成分指定为0.0-1.0之间的一个浮点数值,0.0为完全透明,1.0表示完全不透明。
- 【实例】下面实例使用四色格作为背景,设置globalAlpha为0.2后,在上面画一系列半径递增的半透明圆,最终结果是一个经向渐变效果。圆叠加的越多,原来所画的圆的透明度就越低。通过增加循环次数,画更多的圆,背景图中心部分会完全消失。
<script>
    window.onload = function() {
        draw();

        function draw() {
            var canvas = document.getElementById("canvas");
            if (canvas.getContext) {
                var ctx = canvas.getContext('2d');
                ctx.fillStyle = '#FD0';
                ctx.fillRect(0, 0, 75, 75);
                ctx.fillStyle = '#6C0';
                ctx.fillRect(75, 0, 75, 75);
                ctx.fillStyle = '#09F';
                ctx.fillRect(0, 75, 75, 75);
                ctx.fillStyle = '#F30';
                ctx.fillRect(75, 75, 75, 75);
                ctx.globalAlpha = 0.2;
                for (var i = 0; i < 7; i++) {
                    ctx.beginPath();
                    ctx.arc(75, 75, 10 + 10 * i, 0, Math.PI * 2, true);
                    ctx.fill();
                }

            }
        }
    }
script>

<body>
    <canvas id="canvas" style="border: 1px solid #999;" width="300" height="200">canvas>
body>
实线
- 线的粗细
使用lineWidth属性可以设置线条的粗细,取值必须为正值,默认为1.0。
- 【实例1】下面实例使用for循环绘制了12条线宽一次递增的线段。
<script>
    window.onload = function() {
        draw();

        function draw() {
            var canvas = document.getElementById("canvas");
            if (canvas.getContext) {
                var ctx = canvas.getContext('2d');
                for (var i = 0; i < 12; i++) {
                    ctx.strokeStyle = "red";
                    ctx.lineWidth = 1 + i;
                    ctx.beginPath();
                    ctx.moveTo(5, 5 + i * 14);
                    ctx.lineTo(140, 5 + i * 14);
                    ctx.stroke();
                }
            }

        }
    }
script>

<body>
    <canvas id="canvas" style="border: 1px solid #999;" width="300" height="200">canvas>
body>
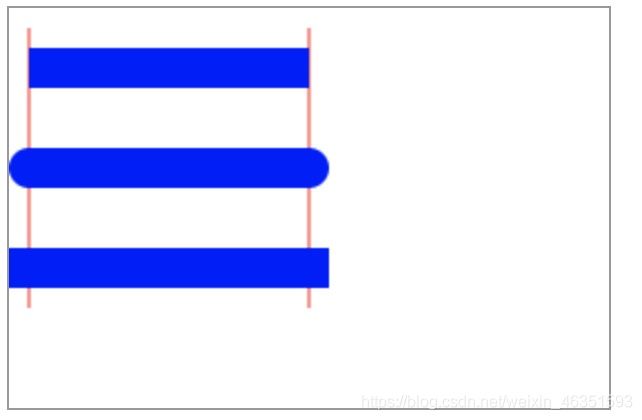
- 端点样式
lineCap属性用于设置线段端点的样式,包括三种:butt、round和square,默认为butt。
- 【实例2】下面实例绘制了三条蓝色的直线段,并依次设置上述三种属性值,两侧有两条红色的参考线,以方便观察。
<script>
    window.onload = function() {
        draw();

        function draw() {
            var canvas = document.getElementById("canvas");
            if (canvas.getContext) {
                var ctx = canvas.getContext('2d');
                var lineCap = ['butt', 'round', 'square'];
                ctx.strokeStyle = 'red';
                ctx.beginPath();
                ctx.moveTo(10, 10);
                ctx.lineTo(10, 150);
                ctx.moveTo(150, 10);
                ctx.lineTo(150, 150);
                ctx.stroke();
                ctx.strokeStyle = 'blue';
                for (var i = 0; i < lineCap.length; i++) {
                    ctx.lineWidth = 20;
                    ctx.lineCap = lineCap[i];
                    ctx.beginPath();
                    ctx.moveTo(10, 30 + i * 50);
                    ctx.lineTo(150, 30 + i * 50);
                    ctx.stroke();
                }
            }

        }
    }
script>

<body>
    <canvas id="canvas" style="border: 1px solid #999;" width="300" height="200">canvas>
body>
- 连接样式
lineJoin属性用于设置两条线段连接处的样式。包括三种样式:round、bevel和miter,默认值为miter。
- 【实例3】下面实例绘制了三条蓝色的直线,并以此设置三个属性值,观察拐角处(即直角段连接处)样式的区别。
<script>
    window.onload = function() {
        draw();

        function draw() {
            var canvas = document.getElementById("canvas");
            if (canvas.getContext) {
                var ctx = canvas.getContext('2d');
                var lineJoin = ['round', 'bevel', 'miter'];
                ctx.strokeStyle = 'blur';
                for (var i = 0; i < lineJoin.length; i++) {
                    ctx.lineWidth = 25;
                    ctx.lineJoin = lineJoin[i];
                    ctx.beginPath();
                    ctx.moveTo(10 + i * 150, 30);
                    ctx.lineTo(100 + i * 150, 30);
                    ctx.lineTo(100 + i * 150, 100);
                    ctx.stroke();
                }
            }

        }
    }
script>

<body>
    <canvas id="canvas" style="border: 1px solid #999;" width="300" height="200">canvas>
body>
- 交点方式
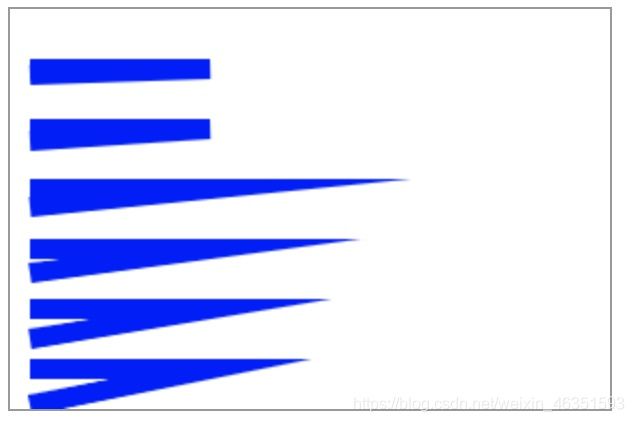
miterLimit属性用于设置两条线段连接处交点的绘制方式,其作用是为斜面的长度设置一个上限,默认为10,即规定斜面的长度不能超过线条宽度的10倍。当斜面的长度达到线条宽度的10倍时,就会变为斜角。如果lineJoin属性round或bevel时,miterLimit属性无效。
- 【实例4】通过下面实例可以观察到,当角度和miterLimit属性值发生变化时斜面长度的变化。在运行代码之前,也可以将miterLimit属性值改为固定值,以观察不同的值产生的结果。
<script>
    window.onload = function() {
        draw();

        function draw() {
            var canvas = document.getElementById("canvas");
            if (canvas.getContext) {
                var ctx = canvas.getContext('2d');
                for (var i = 1; i < 10; i++) {
                    ctx.strokeStyle = 'blue';
                    ctx.lineWidth = 10;
                    ctx.lineJoin = 'miter';
                    ctx.miterLimit = i * 10;
                    ctx.beginPath();
                    ctx.moveTo(10, i * 30);
                    ctx.lineTo(100, i * 30);
                    ctx.lineTo(10, 33 * i);
                    ctx.stroke();
                }

            }

        }
    }
</script>

<body>
    <canvas id="canvas" style="border: 1px solid #999;" width="300" height="200"></canvas>
</body>
虚线
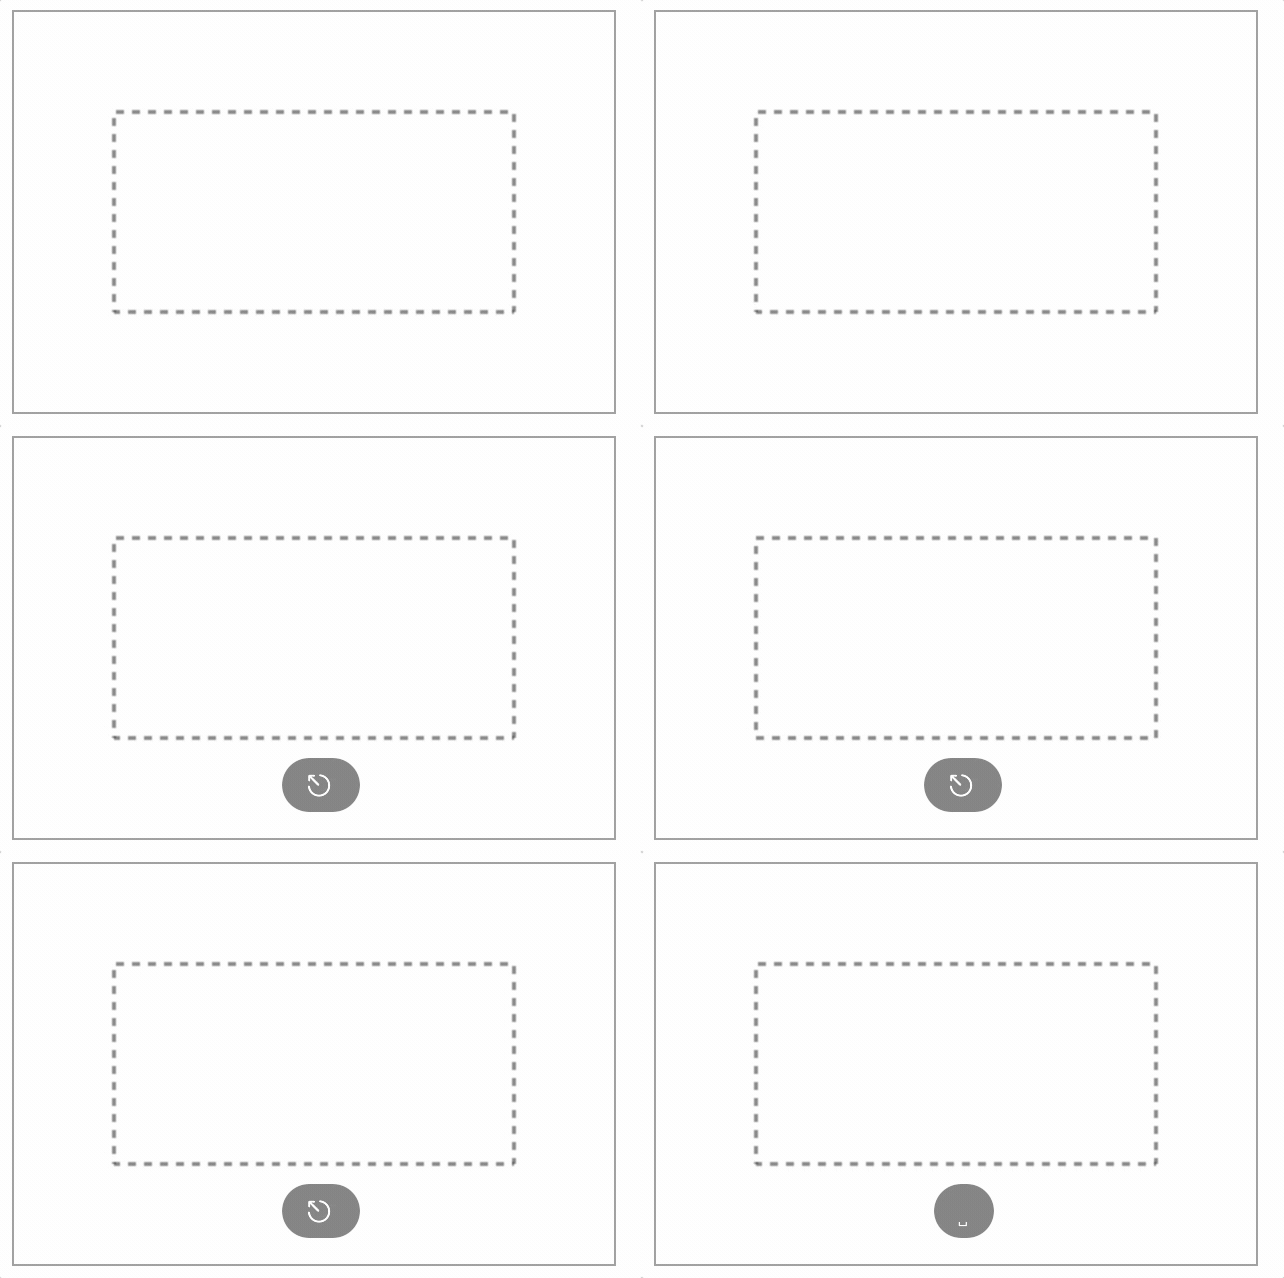
使用setLineDash()方法和lineDashOffset属性可以定义虚线样式。setLineDash()方法接受一个数组来指定线段与间隙的交替,lineDashOffset属性设置起始偏移量。
- 【实例】下面实例绘制一个矩形虚线框,然后使用定时器设计每隔0.5秒重新绘制一次,重绘时改变lineDashOffset属性值,从而创建一个行军蚁的效果。
<script>
    window.onload = function() {
        var ctx = document.getElementById("canvas").getContext('2d');
        var offset = 0;

        function draw() {
            ctx.clearRect(0, 0, canvas.width, canvas.height);
            ctx.setLineDash([4, 4]);
            ctx.lineDashOffset = -offset;
            ctx.strokeRect(50, 50, 200, 100);
        }

        function march() {
            offset++;
            if (offset > 16) {
                offset = 0;
            }
            draw();
            setTimeout(march, 100);
        }
        march();
    }
script>

<body>
    <canvas id="canvas" style="border: 1px solid #999;" width="300" height="200">canvas>
body>
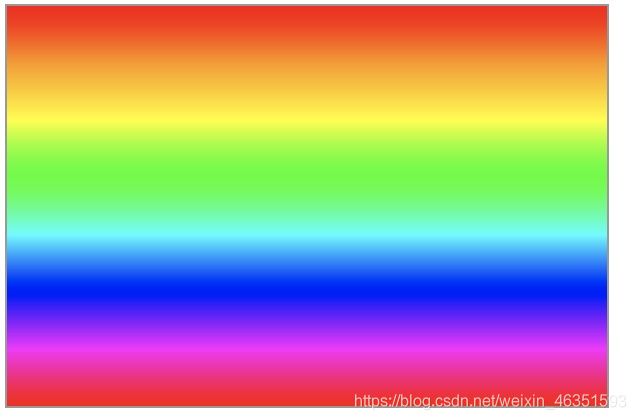
要绘制线性渐变,首先使用createLinearGradient()方法创建canvasGradient对象,然后使用addColorStop()方法进行上色。
createLinearGradient()方法用法如下:
context.createLinearGradient(x0, y0, x1, y1);
参数说明:
- x0:渐变开始点的x坐标。
- y0:渐变开始点的y坐标。
- x1:渐变结束点的x坐标。
- y1:渐变结束点的y坐标。
addColorStop()方法用法如下:
gradient.addColorStop(stop, color);
参数说明:
- stop:介于0.0-1.0之间的值,表示渐变开始与结束之间的相对位置。渐变起点的偏移值为0,重点的偏移值为1.如果position值为0.5,则表示色标出现在渐变的正中间。
- color:在结束位置显示的css颜色值。
- 【实例】下面实例演示如何绘制线性渐变。
<script>
    window.onload = function() {
        draw();

        function draw() {
            var ctx = document.getElementById("canvas").getContext('2d');
            var lingrad = ctx.createLinearGradient(0, 0, 0, 200);
            lingrad.addColorStop(0, '#ff0000');
            lingrad.addColorStop(1 / 7, '#ff9900');
            lingrad.addColorStop(2 / 7, '#ffff00');
            lingrad.addColorStop(3 / 7, '#00ff00');
            lingrad.addColorStop(4 / 7, '#00ffff');
            lingrad.addColorStop(5 / 7, '#0000ff');
            lingrad.addColorStop(6 / 7, '#ff00ff');
            lingrad.addColorStop(1, '#ff0000');
            ctx.fillStyle = lingrad;
            ctx.strokeStyle = lingrad;
            ctx.fillRect(0, 0, 300, 200);
        }
    }
script>

<body>
    <canvas id="canvas" style="border: 1px solid #999;" width="300" height="200">canvas>
body>
使用addColorStop()可以添加多个色标,色标可以在0-1之间任意位置添加。
经向渐变
要绘制经向渐变,首先需要使用createRadialGradient()方法创建canvasGradient对象,然后使用addColorStop()方法进行上色。createRadialGradient()方法的用法:
context.createRadialGradinet(x0, y0, r0, x1, y1, r1);
参数说明:
- x0:渐变开始圆的x坐标。
- y0:渐变开始圆的y坐标。
- r0:开始圆的半径。
- x1:渐变结束圆的x坐标。
- y1:渐变结束圆的y坐标。
- r1:结束圆的半径。
- 【实例】下面实例使用径向渐变在画布中央绘制一个圆球形状。
<script>
    window.onload = function() {
        draw();

        function draw() {
            var ctx = document.getElementById("canvas").getContext('2d');
            var radgrad = ctx.createRadialGradient(150, 100, 0, 150, 100, 100);
            radgrad.addColorStop(0, '#A7D30C');
            radgrad.addColorStop(0.9, '#019F62');
            radgrad.addColorStop(1, 'rgba(1, 159, 98, 0)');

            ctx.fillStyle = radgrad;
            ctx.fillRect = (0, 0, 300, 200);
        }


    }
script>

<body>
    <canvas id="canvas" style="border: 1px solid #999;" width="300" height="200">canvas>
body>
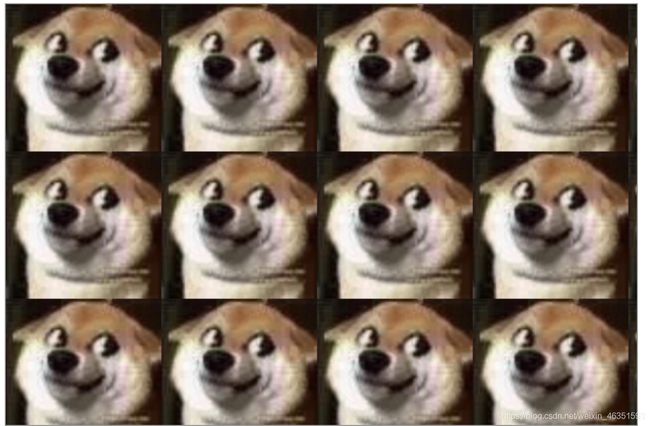
图案
使用createPattern()方法可以绘制图案效果。用法如下:
context.createPattern(image, "repeat|repeat-x|repeat-y|no-repeat");
参数说明如下:
- image:规定要使用的图片、画布或视频元素。
- repeat:默认值。该模式在水平和垂直方向重复。
- repeat-x:该模式只在水平方向重复。
- repeat-y:该模式只在垂直方向重复。
- no-repeat:该模式只显示一次(不重复)。
创建图案步骤与创建渐变有些类似,需要先创建一个pattern对象,然后将其赋予fillStyle属性或strokeStyle属性。
- 【实例】
<script>
    window.onload = function() {
        draw();

        function draw() {
            var ctx = document.getElementById("canvas").getContext('2d');
            var img = new Image();
            img.src = '../img/doge.jpg';
            img.onload = function() {
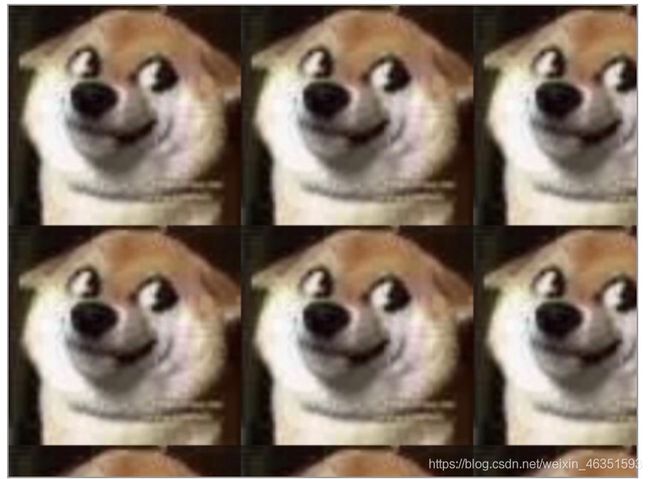
                var ptrn = ctx.createPattern(img, 'repeat');
                ctx.fillStyle = ptrn;
                ctx.fillRect(0, 0, 600, 600);
            }
        }


    }
script>

<body>
    <canvas id="canvas" style="border: 1px solid #999;" width="600" height="400">canvas>
body>
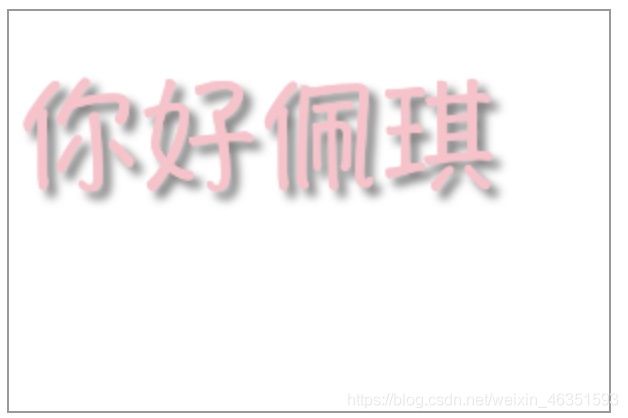
阴影
创建阴影需要四个属性:
-
shadowColor:设置阴影颜色。
-
shadowBlur:设置阴影的模糊级别。
-
shadowOffsetX:设置阴影在x轴的偏移距离。
-
shadowOffsetY:设置阴影在y轴的偏移距离。
-
【实例】下面实例演示如何创建文字阴影效果。
<script>
    window.onload = function() {
        draw();

        function draw() {
            var ctx = document.getElementById("canvas").getContext('2d');
            // 设置阴影
            ctx.shadowOffsetX = 4;
            ctx.shadowOffsetY = 4;
            ctx.shadowBlur = 4;
            ctx.shadowColor = "rgba(0, 0, 0, 0.5)";
            // 绘制文本
            ctx.font = "60px Times New Roman";
            ctx.fillStyle = "pink";
            ctx.fillText("你好佩琪", 5, 80);
        }


    }
script>

<body>
    <canvas id="canvas" style="border: 1px solid #999;" width="300" height="200">canvas>
body>
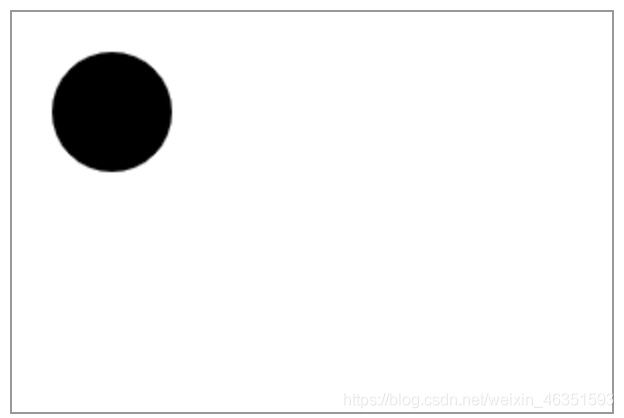
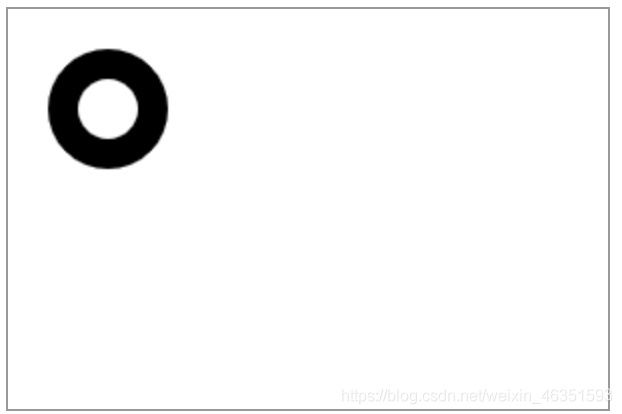
填充规则
前面介绍了fill()方法可以填充图形,该方法可以接受两个值,用来定义填充规则。
- nonzero:非零环绕数规则,为默认值。
- evenodd:奇偶规则。
填充规则根据某处在路径的外面或者里面来决定是否被填充,这对于路径相交或者路径被嵌套的时候极为有用。
- 【实例】下面使用evenodd填充图形。
<script>
    window.onload = function() {
        draw();

        function draw() {
            var ctx = document.getElementById("canvas").getContext('2d');
            ctx.beginPath();
            ctx.arc(50, 50, 30, 0, Math.PI * 2, true);
            ctx.arc(50, 50, 15, 0, Math.PI * 2, true);
            ctx.fill("evenodd");
        }


    }
script>

<body>
    <canvas id="canvas" style="border: 1px solid #999;" width="300" height="200">canvas>
body>
不设置与设置evenodd效果:
图形变形
本节介绍如何对画布进行操作,进行变形以便设计复杂图形。
保存和恢复状态
canvas状态存储在栈中,一个绘画状态包括两部分。
- 当前应用的变形,如移动、旋转、缩放。包括的样式属性:strokeStyle、fillStyle、globalAlpha、lineWidth、lineCap、lineJoin、miterLimit、shadowOffsetX、shadowOffsetY、shadowBlur、shadowColor、globalCompositeOperation。
- 当前裁切路径。
使用save()方法,可以将当前状态推送到栈中保存,使用restore()方法可以将上一个保存的状态从栈中弹出,恢复上一次所有的设置。
- 【实例】下面实例先绘制一个矩形,填充颜色为#ff00ff,轮廓颜色为蓝色,然后保存这个状态,再绘制另外一个矩形,填充颜色为#ff0000,轮廓颜色为绿色;最后恢复第一个矩形的状态,并绘制两个小的矩形,其中一个矩形填充颜色必为#ff00ff,另一个矩形轮廓颜色必为蓝色。因为此时已经恢复了原来保存的状态,所以会沿用最先设定的属性值。
<script>
    window.onload = function() {
        draw();

        function draw() {
            var ctx = document.getElementById("canvas").getContext('2d');
            // 开始绘制矩形
            ctx.fillStyle = "#ff00ff";
            ctx.strokeStyle = "blue";
            ctx.fillRect(20, 20, 100, 100);
            ctx.strokeRect(20, 20, 100, 100);
            ctx.fill();
            ctx.stroke();

            ctx.save(); //保存当前canvas状态
            // 绘制另一个矩形
            ctx.fillStyle = "#ff0000";
            ctx.strokeStyle = "green";
            ctx.fillRect(140, 20, 100, 100);
            ctx.strokeRect(140, 20, 100, 100);
            ctx.fill();
            ctx.stroke();

            ctx.restore(); //恢复第一个矩形的状态
            ctx.fillRect(20, 140, 50, 50);
            ctx.strokeRect(80, 140, 50, 50);
        }


    }
script>

<body>
    <canvas id="canvas" style="border: 1px solid #999;" width="300" height="200">canvas>
body>
清除画布
使用clearRect()方法可以清除指定区域内的所有图形,显示画布背景。
context.clearRect(x, y, width, height);
参数说明如下。
-
x:要清除的矩形左上角的x坐标。
-
y:要清除的矩形左上角的y坐标。
-
width:要清除的矩形的宽度,以像素计。
-
height:要清除的矩形的高度,以像素计。
-
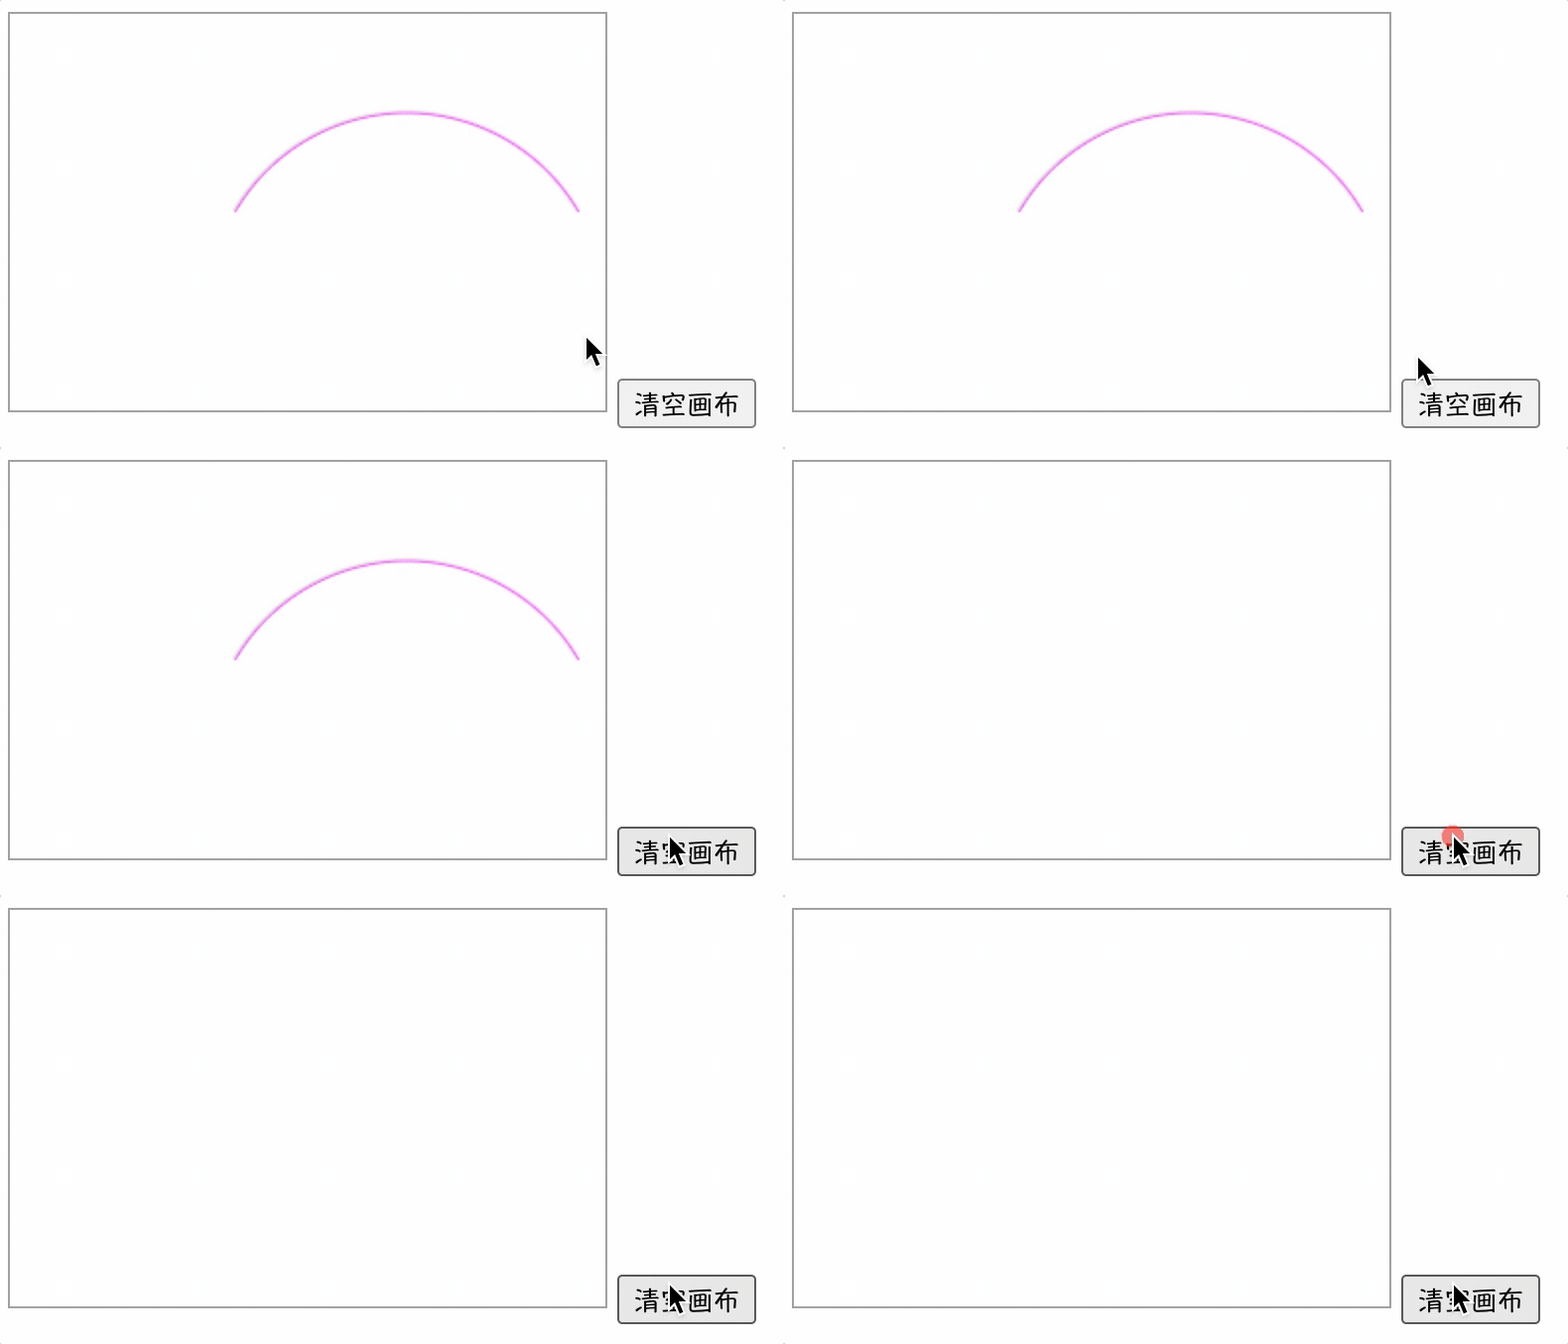
【实例】下面实例演示了如何使用clearRect()方法擦除画布中的绘图。
<script>
    window.onload = function() {
        draw();


        function draw() {

            var ctx = document.getElementById("canvas").getContext('2d');
            ctx.strokeStyle = '#FF00FF';
            ctx.beginPath();
            ctx.arc(200, 150, 100, -Math.PI * 1 / 6, -Math.PI * 5 / 6, true);
            ctx.stroke();

            var btn = document.getElementsByTagName('input')[0];
            btn.onclick = function() {
                ctx.clearRect(0, 0, 300, 200);
            }

        }


    }
script>

<body>
    <canvas id="canvas" style="border: 1px solid #999;" width="300" height="200">canvas>
    <input type="button" name="" value="清空画布">
body>
移动坐标
在默认状态下,画布以左上角(0, 0)为原点作为绘图参考。使用translate()方法可以移动坐标原点,这样新绘制的图形就以新的坐标原点作为参考进行绘制。其用法如下:
context.translate(dx, dy);
参数dx和dy分别为坐标原点沿水平和垂直两个方向的偏移量。
-
注意:在使用translate()方法之前,应该先使用save()方法保存画布的原始状态。当需要时可以使用restore()方法恢复原始状态,这在重复绘图时非常重要。
-
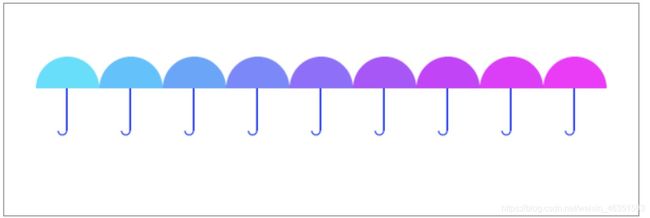
【实例】下面实例综合运用了save()、restore()、translate()方法绘制一个伞状图形。
<script>
    window.onload = function() {
        draw();


        function draw() {

            var ctx = document.getElementById("canvas").getContext('2d');
            // 注意:所有移动都是基于这一上下文
            ctx.translate(0, 80);
            for (var i = 1; i < 10; i++) {
                ctx.save();
                ctx.translate(60 * i, 0);
                drawTop(ctx, "rgb(" + (30 * i) + "," + (255 - 30 * i) + ",255)");
                drawGrip(ctx);
                ctx.restore();
            }
            // 绘制伞形顶部半圆
            function drawTop(ctx, fillStyle) {
                ctx.fillStyle = fillStyle;
                ctx.beginPath();
                ctx.arc(0, 0, 30, 0, Math.PI, true);
                ctx.closePath();
                ctx.fill();
            }

            // 绘制伞形底部手柄
            function drawGrip(ctx) {
                ctx.save();
                ctx.fillStyle = "blue";
                ctx.fillRect(-1.5, 0, 1.5, 40);
                ctx.beginPath();
                ctx.strokeStyle = "blue";
                ctx.arc(-5, 40, 4, Math.PI, Math.PI * 2, true);
                ctx.stroke();
                ctx.closePath();
                ctx.restore();
            }

        }


    }
script>

<body>
    <canvas id="canvas" style="border: 1px solid #999;" width="600" height="200">canvas>
body>
在浏览器中浏览效果如图,可见,canvas中图形移动的实现,其实是通过改变画布的坐标原点来实现的,所谓的”移动图形“,只是看上去的样子 ,实际移动的是坐标空间。
旋转坐标
使用rotate()方法可以以原点为中心旋转canvas上下文对象的坐标空间。用法如下:
context.rotate(angle);
rotate()方法只有一个参数,即旋转角度angle,旋转角度以顺时针方向为正方向,以弧度为单位,旋转中心为canvas的原点。
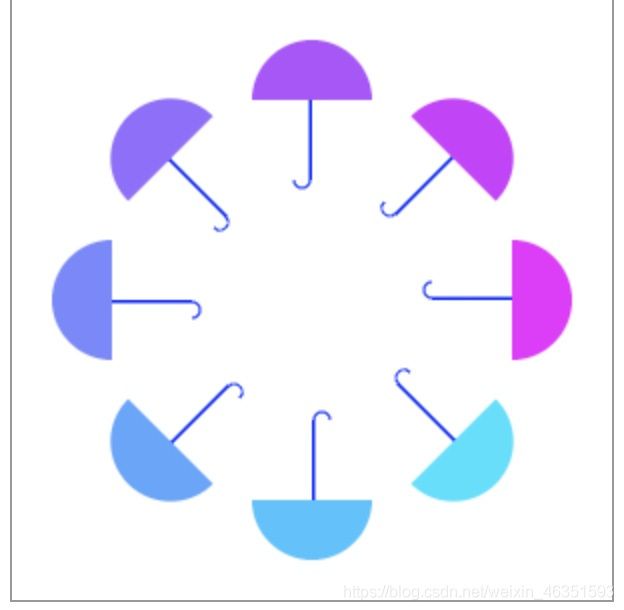
- 【实例】在上个实例的基础上,下面实例设计在每次开始绘制图形之前,现将做表空间旋转PI*(2/4+i/4),再将坐标空间沿y轴负方向移动100,然后开始绘制图形,从而实现图形沿以中心点平均旋转分布。
<script>
    window.onload = function() {
        draw();


        function draw() {

            var ctx = document.getElementById("canvas").getContext('2d');
            // 注意:所有移动都是基于这一上下文
            ctx.translate(150, 150);
            for (var i = 1; i < 9; i++) {
                ctx.save();
                ctx.rotate(Math.PI * (2 / 4 + i / 4));
                ctx.translate(0, -100);
                drawTop(ctx, "rgb(" + (30 * i) + "," + (255 - 30 * i) + ",255)");
                drawGrip(ctx);
                ctx.restore();
            }
            // 绘制伞形顶部半圆
            function drawTop(ctx, fillStyle) {
                ctx.fillStyle = fillStyle;
                ctx.beginPath();
                ctx.arc(0, 0, 30, 0, Math.PI, true);
                ctx.closePath();
                ctx.fill();
            }

            // 绘制伞形底部手柄
            function drawGrip(ctx) {
                ctx.save();
                ctx.fillStyle = "blue";
                ctx.fillRect(-1.5, 0, 1.5, 40);
                ctx.beginPath();
                ctx.strokeStyle = "blue";
                ctx.arc(-5, 40, 4, Math.PI, Math.PI * 2, true);
                ctx.stroke();
                ctx.closePath();
                ctx.restore();
            }

        }


    }
script>

<body>
    <canvas id="canvas" style="border: 1px solid #999;" width="300" height="300">canvas>
body>
缩放图形
使用scale()方法可以增减canvas上下文对象的像素数目,从而使吸纳图形的放大和缩小。
用法如下:
context.scale(x, y);
其中,x为横轴的缩放因子,y为纵轴的缩放因子,值必须是正值。如果需要放大图形,则将参数设置为大于1的数值,如果需要缩小图形,则将参数设置为小于1的数值,当参数值等于1时则没有任何效果。
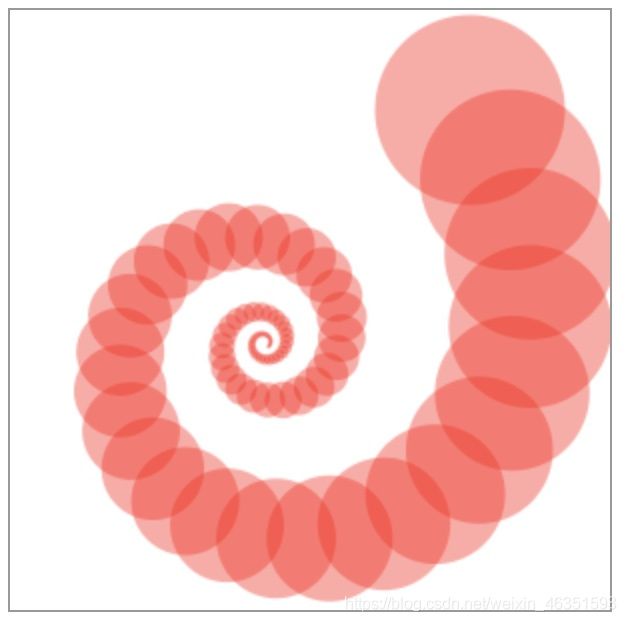
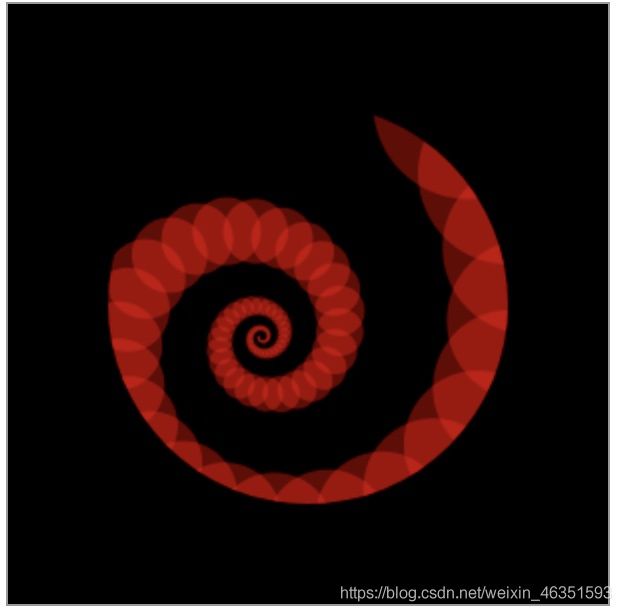
- 【实例】下面实例使用scale(0.95,0.95)来缩小图形到上次的0.95,共循环80次,同时移动和旋转坐标空间,从而实现图形呈螺旋状由大到小的变化。
<script>
    window.onload = function() {
        draw();


        function draw() {

            var ctx = document.getElementById("canvas").getContext('2d');
            ctx.translate(200, 20);
            for (var i = 1; i < 80; i++) {
                ctx.save();
                ctx.translate(30, 30);
                ctx.scale(0.95, 0.95);
                ctx.rotate(Math.PI / 12);
                ctx.beginPath();
                ctx.fillStyle = "red";
                ctx.globalAlpha = "0.4";
                ctx.arc(0, 0, 50, 0, Math.PI * 2, true);
                ctx.closePath();
                ctx.fill();
            }
        }
    }
script>

<body>
    <canvas id="canvas" style="border: 1px solid #999;" width="300" height="300">canvas>
body>
变换图形
transform()方法可以同时缩放、旋转、移动和倾斜当前的上下文环境。
context.transform(a, b, c, d, e, f);
参数说明:
- a:水平缩放绘图。
- b:水平倾斜绘图。
- c:垂直倾斜绘图。
- d:垂直缩放绘图。
- e:水平移动绘图。
- f:垂直移动绘图。
提示:
- translate(x, y)可以用下面方法来代替。
context.transform(0, 1, 1, 0, dx, dy);
或:
context.transform(1, 0, 0, 1, dx, dy);
其中dx为原点沿x轴移动的数值,dy为原点沿y轴移动的数值。
- scale(x, y)可以用下面的方法来代替,
context.transform(m11, 0, 0, m22, 0, 0);
或:
context.transform(0, m12, m21, 0, 0, 0);
其中,dx、dy都为0表示坐标原点不变,m11、m22或m12、m21为沿x、y轴放大的倍数。
- rotate(angle)可以使用下面方法来代替。
context.transform(cos0, sin0, -sin0, cos0, 0, 0);
其中,θ为旋转角度的弧度值,dx、dy都为0,表示坐标原点不变。
setTransform()方法用于将当前的变化矩阵重置为最初的矩阵,然后以相同的的参数调用transform()方法。用法如下:
context.setTransform(m11, m12, m21, m22, dx, dy);
- 【实例】下面实例使用setTransform()方法首先将前面已经发生变换的矩阵重置为最初的矩阵,即恢复最初的原点,然后再将坐标原点改为(10,10),并以新坐标为基准绘制蓝色矩阵。
<script>
    window.onload = function() {
        draw();


        function draw() {

            var ctx = document.getElementById("canvas").getContext('2d');
            ctx.translate(200, 20);
            for (var i = 1; i < 90; i++) {
                ctx.save();
                // ctx.translate(30, 30);
                // ctx.scale(0.95, 0.95);
                ctx.transform(0.95, 0, 0, 0.95, 30, 30);
                ctx.rotate(Math.PI / 12);
                ctx.beginPath();
                ctx.fillStyle = "red";
                ctx.globalAlpha = "0.4";
                ctx.arc(0, 0, 50, 0, Math.PI * 2, true);
                ctx.closePath();
                ctx.fill();
            }
            ctx.setTransform(1, 0, 0, 1, 10, 10);
            ctx.fillStyle = "blue";
            ctx.fillRect(0, 0, 50, 50);
            ctx.fill();

        }


    }
script>

<body>
    <canvas id="canvas" style="border: 1px solid #999;" width="300" height="300">canvas>
body>
在本例中,使用scale(0.95, 0.95)来缩小图形到上次的0.95,共循环89次,同时移动和旋转做表空间,从而使吸纳图形成螺旋状由大到小的变化。
图形合成
合成
当两个或两个以上的图形存在重叠区域时,默认一个图形画在前一个图形之上。通过制定图形globalCompositeOperation属性的值可以改变图形的绘制顺序或绘制方式,从而实现更多的可能。
裁切
使用clip()方法能够从原始画布中剪切任意形状和尺寸。其原理与绘制普通canvas图形类似,只不过clip()的作用是形成一个蒙版,没有被蒙版的区域会被隐藏。
- 提示:在使用clip()方法前,通过使用save()方法对当前画布区域进行保存,并可以在以后的任意时间通过restore()方法对其进行恢复。
- 【实例】如果绘制一个圆形,并进行裁切,则圆形之外的区域将不会绘制在canvas上。
<script>
    window.onload = function() {
        draw();


        function draw() {

            var ctx = document.getElementById("canvas").getContext('2d');
            // 绘制背景
            ctx.fillStyle = "black";
            ctx.fillRect(0, 0, 300, 300);
            ctx.fill();
            ctx.beginPath();
            ctx.arc(150, 150, 100, 0, Math.PI * 2, true);
            ctx.clip();
            ctx.translate(200, 20);
            for (var i = 1; i < 90; i++) {
                ctx.save();
                // ctx.translate(30, 30);
                // ctx.scale(0.95, 0.95);
                ctx.transform(0.95, 0, 0, 0.95, 30, 30);
                ctx.rotate(Math.PI / 12);
                ctx.beginPath();
                ctx.fillStyle = "red";
                ctx.globalAlpha = "0.4";
                ctx.arc(0, 0, 50, 0, Math.PI * 2, true);
                ctx.closePath();
                ctx.fill();
            }
        }
    }
script>

<body>
    <canvas id="canvas" style="border: 1px solid #999;" width="300" height="300">canvas>
body>
绘制文本
使用fillText()和strokeText()方法,可以分别以填充方式和轮廓方式绘制文本。
填充文字
fillText()方法能够在画布上绘制填色文本,默认颜色是黑色。其用法如下:
context.fillText(text, x, y, maxWidth);
参数说明:
- text:规定在画布上输出的文本。
- x:开始绘制文本的x坐标位置(相对与画布)。
- y:开始绘制文本的y坐标位置(相对与画布)。
- maxWidth:可选参数,云溪的最大文本宽度,以像素计。
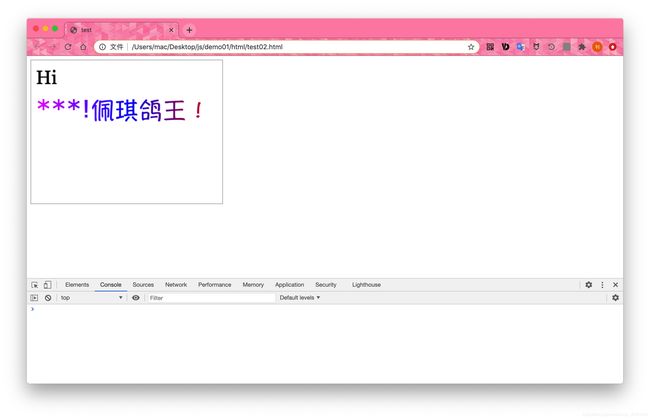
- 【实例】下面使用fillText()方法在画布上绘制文本”Hi“和”佩琪鸽王!“。
<script>
    window.onload = function() {
        draw();


        function draw() {

            var ctx = document.getElementById("canvas").getContext('2d');
            ctx.font = "40px Georgia"
            ctx.fillText("Hi", 10, 50);
            ctx.font = "50px Verdana";
            // 创建渐变
            var gradient = ctx.createLinearGradient(0, 0, canvas.width, 0);
            gradient.addColorStop("0", "magenta");
            gradient.addColorStop("0.5", "blue");
            gradient.addColorStop("1.0", "red");
            // 用渐变填色
            ctx.fillStyle = gradient;
            ctx.fillText("***!佩琪鸽王!", 10, 120);


        }
    }
script>

<body>
    <canvas id="canvas" style="border: 1px solid #999;" width="400" height="300">canvas>
body>
轮廓文字
使用strokeText()方法可以在画布上绘制描边文体,默认颜色是黑色。其用法如下:
context.strokeText(text, x, y, maxWidth);
参数说明:
-
text:规定在画布上输出的文本。
-
x:开始绘制文本的x坐标位置(相对于画布)。
-
y:开始绘制文本的y坐标位置(相对于画布)。
-
maxWidth:可选参数,允许的最大文本宽度,以像素计。
-
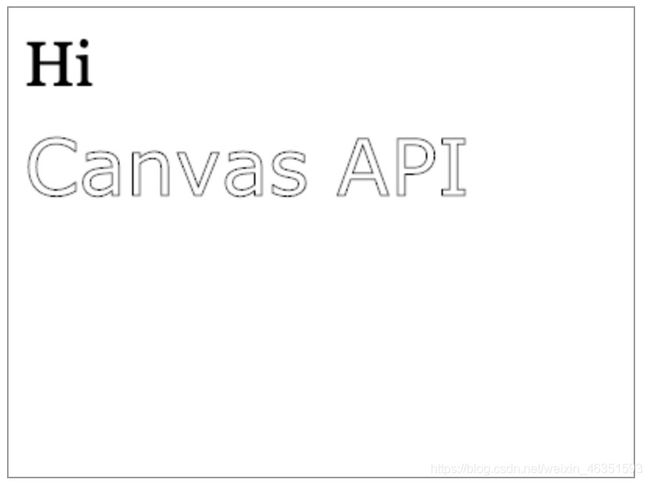
【实例】下面使用strokeText()方法绘制文本”Hi“和”Canvas API“。
<script>
    window.onload = function() {
        draw();


        function draw() {

            var ctx = document.getElementById("canvas").getContext('2d');
            ctx.font = "40px Georgia"
            ctx.fillText("Hi", 10, 50);
            ctx.font = "50px Verdana";
            // 创建渐变
            var gradient = ctx.createLinearGradient(0, 0, canvas.width, 0);
            gradient.addColorStop("0", "magenta");
            gradient.addColorStop("0.5", "blue");
            gradient.addColorStop("1.0", "red");
            // 用渐变填色
            ctx.stokeStyle = gradient;
            ctx.strokeText("Canvas API", 10, 120);


        }
    }
script>

<body>
    <canvas id="canvas" style="border: 1px solid #999;" width="400" height="300">canvas>
body>
文本样式
下面简单介绍文本样式的相关属性。
- font:定义字体样式,语法与CSS字体样式相同。默认字体样式为10px sans-serif。
- textAlign:设置正在绘制的文本水平对齐方式,取值说明如下。
- start:默认值,文本在指定的位置开始。
- end:文本在指定的位置结束。
- center:文本的中心被放置在指定的位置。
- left:文本左对齐。
- right:文本右对齐。
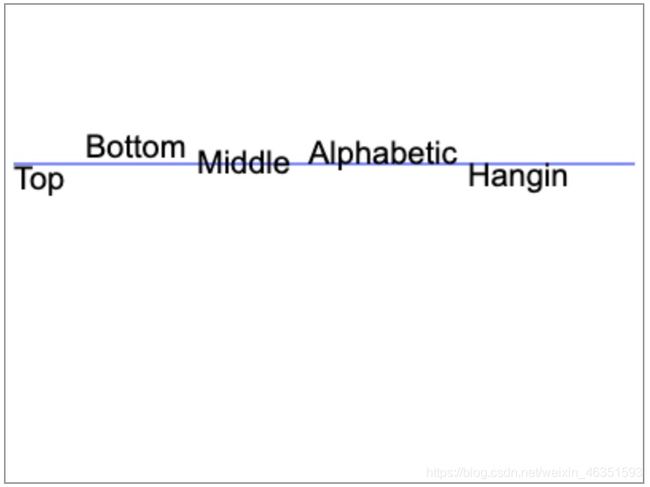
- textBaseline:设置正在绘制的文本基线对齐方式,即文本垂直对齐方式,取值说明如下。
- alphabetic:默认值,文本基线是普通的子母基线。
- top:文本基线是en方框的顶端。
- hanging:文本基线是悬挂基线。
- middle:文本基线是em方框的正中间。
- ideographic:文本基线是表意基线。
- bottom:文本基线是em方框的底端。
- direction:设置文本方向,取值说明如下。
- ltr:从左到右。
- rtl:从右到左。
- inherit:默认值,继承文本方向。
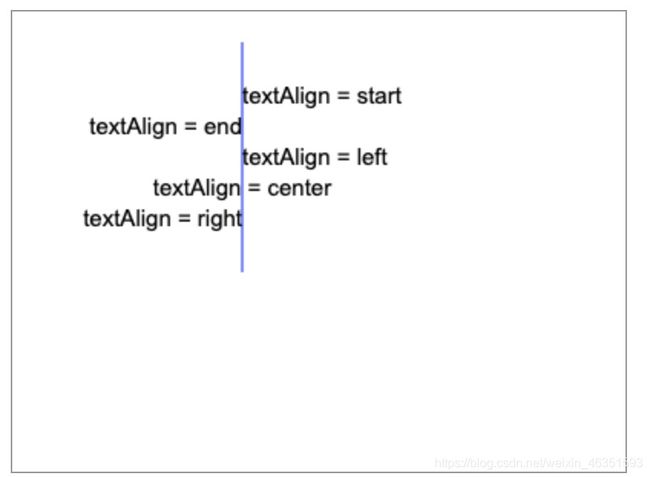
- 【实例1】下面实例在x轴150px的位置创建一条竖线,位置150就被定义为所有文本的锚点。然后比较每种textAlign属性值对齐效果。
<script>
    window.onload = function() {
        draw();


        function draw() {

            var ctx = document.getElementById("canvas").getContext('2d');
            // 在位置150创建一条竖线
            ctx.strokeStyle = "blue";
            ctx.moveTo(150, 20);
            ctx.lineTo(150, 170);
            ctx.stroke();
            ctx.font = "15px Arial";
            // 显示不同的textAlign值
            ctx.textAlign = "start";
            ctx.fillText("textAlign = start", 150, 60);
            ctx.textAlign = "end";
            ctx.fillText("textAlign = end", 150, 80);
            ctx.textAlign = "left";
            ctx.fillText("textAlign = left", 150, 100);
            ctx.textAlign = "center";
            ctx.fillText("textAlign = center", 150, 120);
            ctx.textAlign = "rigth";
            ctx.fillText("textAlign = right", 150, 140);


        }
    }
script>

<body>
    <canvas id="canvas" style="border: 1px solid #999;" width="400" height="300">canvas>
body>
- 【实例2】下面实例在y轴100px的位置创建一条水平线。位置100被定义为蓝色填充,然后比较每种textBaseline属性值对齐效果。
<script>
    window.onload = function() {
        draw();


        function draw() {

            var ctx = document.getElementById("canvas").getContext('2d');
            // 在位置 y=100 绘制蓝色线条
            ctx.strokeStyle = "blue";
            ctx.moveTo(5, 100);
            ctx.lineTo(395, 100);
            ctx.stroke();
            ctx.font = "20px Arial";
            // 在位置 y=100 以不同的textBaseline值放置每个单词
            ctx.textBaseline = "top";
            ctx.fillText("Top", 5, 100);
            ctx.textBaseline = "bottom";
            ctx.fillText("Bottom", 50, 100);
            ctx.textBaseline = "middle";
            ctx.fillText("Middle", 120, 100);
            ctx.textBaseline = "alphabetic";
            ctx.fillText("Alphabetic", 190, 100);
            ctx.textBaseline = "hanging";
            ctx.fillText("Hangin", 290, 100);
        }
    }
script>

<body>
    <canvas id="canvas" style="border: 1px solid #999;" width="400" height="300">canvas>
body>
测量宽度
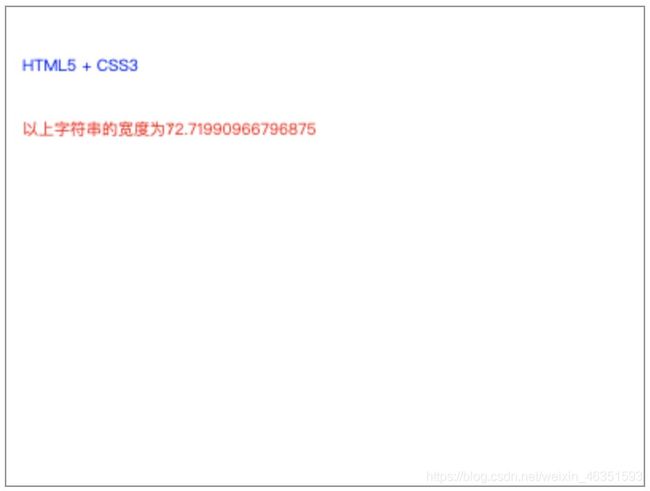
使用measureText()方法可以测量当前所绘制文字中指定文字的宽度,它返回一个TextMetrics对象,使用该对象的width属性可以得到指定文字参数后所有绘制文字的总宽度。用法如下:
metrics = context.measureText(text);
其中的参数text为要绘制的文字。
-
提示:如果需要在文本向画布输出之前就了解文本的宽度,应该使用该方法。
-
【实例】下面是测量文字宽度的一个实例。
<script>
    window.onload = function() {
        draw();


        function draw() {

            var ctx = document.getElementById("canvas").getContext('2d');
            ctx.font = "blod 20px 楷体";
            ctx.fillStyle = "Blue";
            var txt1 = "HTML5 + CSS3";
            ctx.fillText(txt1, 10, 40);
            var txt2 = "以上字符串的宽度为:";
            var mtxt1 = ctx.measureText(txt1);
            var mtxt2 = ctx.measureText(txt2);
            ctx.font = "blod 15px 宋体";
            ctx.fillStyle = "Red";
            ctx.fillText(txt2, 10, 80);
            ctx.fillText(mtxt1.width, mtxt2.width, 80);

        }
    }
script>

<body>
    <canvas id="canvas" style="border: 1px solid #999;" width="400" height="300">canvas>
body>
在canvas中可以导入图像。导入的图像可以改变大小、裁切或合成。canvas支持多种图像格式,如PNG、GIF、JPEG等。
导入图像
在canvas中导入图像的步骤如下。
确定图像来源有以下4种方式,用户可以任选一种。
- 页面内的图片:如果已知图片元素的ID,则可以通过document.images集合、document.getElementByTagName()或document.getElementById()等方法获取页面的图片元素。
- 其他canvas元素:可以通过document.getElmentByTagName()或document.getElementById()等方法获取已经设计好的canvas元素。例如,可以使用这种方法作为一个比较大的canvas生成缩略图。
- 用脚本创建一个新的Image对象:使用脚本可以从零点开始创建一个新的Image对象。不过这种方法存在一种缺点:如果图像文件来源于网络且较大,则会花费较长时间来装载。所以如果不希望因为图像文件装载时间过长而等待,就需要做好预装载的工作。
- 使用data:url方式引用图像:这种方法允许用Base64编码的字符串来定义一个图片;优点是图片可以即使使用,不必等待装载,而且迁移也非常容易;缺点是无法缓存图像,所以如果图片较大,则不太合适这种方法,因为这会导致嵌入的url数据相当庞大。
使用脚本创建image对象时,其方法如下:
var img = new Image(); //创建新的Image对象
img.src = 'image1.png'; //设置图像路径
如果要解决图片预装载问题,可以使用onload事件一边装载一边绘制图像函数。
var img = new Image();
img.onload = function(){

}
img.src = 'image1.png';
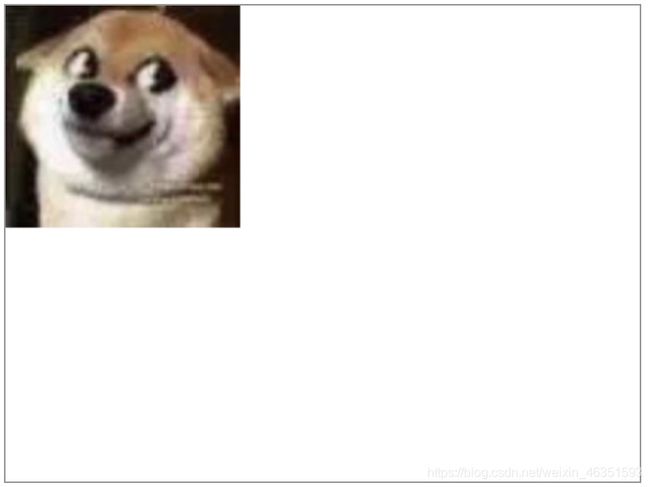
不管采用什么方法获取图像资源,之后的工作都是使用drawImage()方法将图像绘制到canvas中,drawImage()方法能够在画布上绘制图像、画布或视频。该方法也能够绘制图像的某些部分,以及增加或减小图像的尺寸。用法如下:
//语法1:在画布上定位图像
context.drawImage(img, x, y);
//语法2:在画布上定位图像,并规定图像的宽度和高度
context.drawImage(img, x, y, width, height);
//语法3:剪切图像,并在画布上定位被剪切的部分
context.drawImage(img, sx, sy, swidth, sheight, x, y, width, height);
参数说明:
-
img:规定要使用的图像、画布或视频。
-
sx:可选。开始剪切的x坐标位置。
-
sy:可选。开始剪切的y坐标位置。
-
swidth:可选。被剪切图像的宽度。
-
sheight:可选。被剪切图像的高度。
-
x:在画布上放置图像的x坐标位置。
-
y:在画布上放置图像的y坐标位置。
-
width:可选。要使用的图像的宽度,可以实现伸展或缩小图像。
-
height:可选。要使用的图像的高度,可以实现伸展或缩小图像。
-
【实例】下面实例演示了如何使用上述步骤将图像引入canvas中。
<script>
    window.onload = function() {
        draw();


        function draw() {

            var ctx = document.getElementById("canvas").getContext('2d');
            var img = new Image();
            img.onload = function() {
                ctx.drawImage(img, 0, 0);
            }
            img.src = '../img/doge.jpg'
        }
    }
script>

<body>
    <canvas id="canvas" style="border: 1px solid #999;" width="400" height="300">canvas>
body>
缩放图像
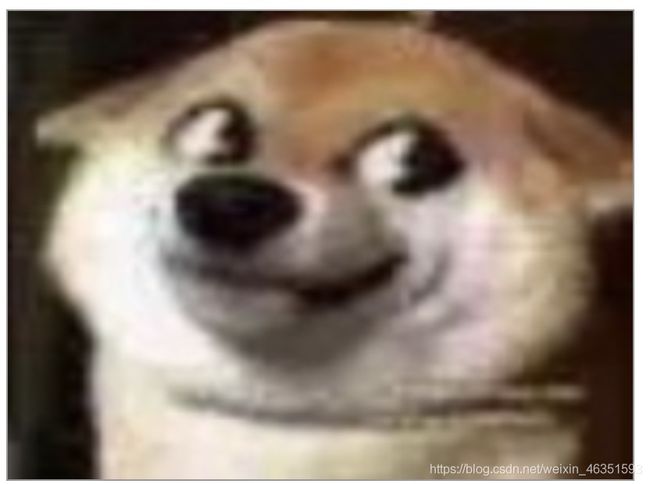
drawImage()方法的第2种方法可以用于使用图片按指定的大小显示。
context.drawImage(image, x, y, width, height);
其中width和height分别是图像在canvas中显示的宽度和高度。
- 【实例】下面实例将导入的图片放大显示。
<script>
    window.onload = function() {
        draw();


        function draw() {

            var ctx = document.getElementById("canvas").getContext('2d');
            var img = new Image();
            img.onload = function() {
                ctx.drawImage(img, 0, 0, 400, 300);
            }
            img.src = '../img/doge.jpg'
        }
    }
script>

<body>
    <canvas id="canvas" style="border: 1px solid #999;" width="400" height="300">canvas>
body>
裁切图像
drawImage()的第三种方法用于创建图像切片。用法如下:
context.drawImage(image, sx, sy, sw, sh, dx, dy, dw, dh);
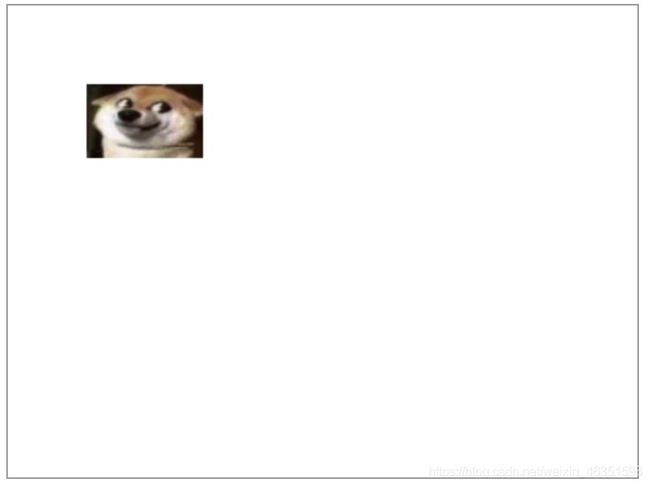
sx、sy为原图像被切割区域,sw、sh为原图像被切下来的宽度和高度;dx、dy为被切割下来的原图像要方式到的位置,dw、dh为被切割下来的图像的宽度和高度。
<script>
    window.onload = function() {
        draw();


        function draw() {

            var ctx = document.getElementById("canvas").getContext('2d');
            var img = new Image();
            img.onload = function() {
                ctx.drawImage(img, 0, 0, 200, 150, 50, 50, 100, 50);
            }
            img.src = '../img/doge.jpg'
        }
    }
script>

<body>
    <canvas id="canvas" style="border: 1px solid #999;" width="400" height="300">canvas>
body>
平铺图像
图像平铺就是让图像铺满画布,有两种方法可以实现,下面结合实例进行说明。
- 【实例1】第一种方法是使用drawImage()方法。
<script>
    window.onload = function() {
        draw();


        function draw() {

            var ctx = document.getElementById("canvas").getContext('2d');
            var image = new Image();
            image.src = '../img/doge.jpg';
            image.onload = function() {
                var scale = 5;
                var n1 = image.width / scale;
                var n2 = image.heigth / scale;
                var n3 = canvas.width / n1;
                var n4 = canvas.height / n2;
                for (var i = 0; i < n3; i++) {
                    for (var j = 0; j < n4; j++) {
                        ctx.drawImage(image, i * n1, j * n2, n1, n2);
                    }
                }
            }

        }
    }
script>

<body>
    <canvas id="canvas" style="border: 1px solid #999;" width="400" height="300">canvas>
body>
- 【实例2】使用createPattern()方法,该方法只用了几个参数。
context.createPattern(image, type);
参数image为要平铺的图像,参数type必须是下面的字符串之一。
- no-repeat:不平铺。
- repeat-x:横方向平铺。
- repeat-y:纵方向平铺。
- repeat:全方向平铺。
<script>
    window.onload = function() {
        draw();


        function draw() {

            var ctx = document.getElementById("canvas").getContext('2d');
            var image = new Image();
            image.src = '../img/doge.jpg';
            image.onload = function() {
                var ptrn = ctx.createPattern(image, 'repeat');
                ctx.fillStyle = ptrn;
                ctx.fillRect(0, 0, 400, 300);
            }

        }
    }
script>

<body>
    <canvas id="canvas" style="border: 1px solid #999;" width="400" height="300">canvas>
body>
