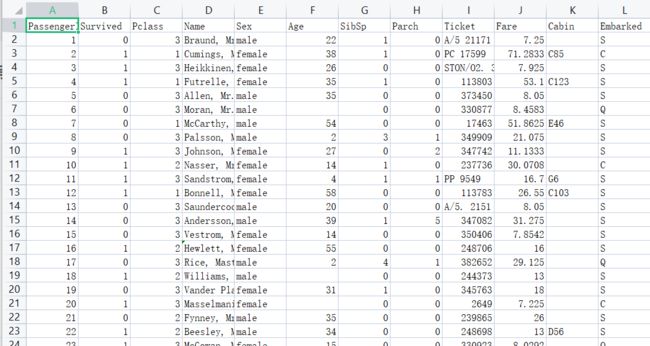
一、数据截图
二、 代码
import pandas as pd
from sklearn.ensemble import RandomForestClassifier
from sklearn.feature_extraction import DictVectorizer
from sklearn.model_selection import train_test_split, GridSearchCV
from sklearn.tree import DecisionTreeClassifier, export_graphviz


def titanic():
#1.获取数据
    path="train.csv"
    titanic=pd.read_csv(path)#,nrows=100)
    #print(titanic)
    #已知数据有下列特征值
    #PassengerId	Survived	Pclass	Name	Sex	Age	  SibSp	 Parch	Ticket	Fare	Cabin	Embarked
    #乘客id          是否生存      阶级   姓名    性别 年龄 有兄弟姐妹 口渴    票    票价      隔间    上船位置
    #方法1-缺失值处理-删去
    #titanic.dropna(axis=0,how="any",inplace=True)
    # 分析选取特征值
    x = titanic[["Pclass", "Sex", "Age"]]
    # 目标值
    y = titanic["Survived"]
    #print(x)
#2.数据处理
    #0)检查是否存在缺失值(可先将所有数据进行判别
    #x_Pclass_exist_nan=x["Pclass"].isnull().values.any()
    #x_Sex_exist_nan=x["Sex"].isnull().values.any()
    #x_Age_exist_nan=x["Age"].isnull().values.any()
    #y_exist_nan=y.isnull().values.any()
    # print("特征值Pclass是否有nan:",x_Pclass_exist_nan,
    #       "\n特征值Sex是否有nan:",x_Sex_exist_nan,
    #       "\n特征值Age是否有nan:",x_Age_exist_nan)
    # print("目标值是否有nan:",y_exist_nan)
    #方法2-缺失值处理-平均值
    x["Age"].fillna(x["Age"].mean(),inplace=True)
    #print(x)
    #转换成字典
    x=x.to_dict(orient="records")
#3划分数据集
    x_train, x_test, y_train, y_test = train_test_split(x,y,random_state=22)
#4字典特征抽取
    transfer = DictVectorizer()
    x_train = transfer.fit_transform(x_train)
    x_test = transfer.transform(x_test)
#5决策树预估器

    # 加入网格搜索和交叉验证
    estimator=RandomForestClassifier()

    param_dict = {"n_estimators": [120, 200, 300, 500, 800, 1200],
                  "max_depth":[5,8,15,25,30]}
    estimator = GridSearchCV(estimator, param_grid=param_dict, cv=3)
    estimator.fit(x_train, y_train)


#6模型评估
    # 1.对比真实值和预测值
    y_predict=estimator.predict(x_test)
    print("真实值和预测值比对\n",y_test==y_predict)
    # 2.计算准确率
    score=estimator.score(x_test,y_test)
    print("准确率为\n",score)#整体测试集的效果

    #网格搜索与交叉验证结果的参数
    print("最佳参数\n",estimator.best_params_)
    print("最佳结果\n",estimator.best_score_)#验证集中的结果
    print("最佳估计器\n",estimator.best_estimator_)
    print("交叉验证结果\n",estimator.cv_results_)

#7可视化决策树
    export_graphviz(estimator, out_file="./titanic.tree.dot", feature_names=transfer.get_feature_names())


if __name__ == '__main__':
    titanic()
三、运行结果
真实值和预测值比对
 816    False
789     True
869    False
235    False
473     True
       ...
174     True
723     True
350     True
399     True
194     True
Name: Survived, Length: 223, dtype: bool
准确率为
 0.7713004484304933
最佳参数
 {'max_depth': 5, 'n_estimators': 120}
最佳结果
 0.8159011028966185
最佳估计器
 RandomForestClassifier(max_depth=5, n_estimators=120)
交叉验证结果
 {'mean_fit_time': array([0.13299497, 0.21445537, 0.34839487, 0.54510999, 0.88557641,
       1.42996311, 0.14926664, 0.24255347, 0.38314478, 0.60953983,
       1.00982849, 1.51456213, 0.15878431, 0.26461275, 0.39483476,
       0.66195901, 1.05658213, 1.58990987, 0.16172369, 0.26080561,
       0.39532431, 0.66376098, 1.06954074, 1.62762157, 0.16098619,
       0.26103052, 0.3728656 , 0.65319649, 1.0090692 , 1.5897665 ]), 'std_fit_time': array([0.0020517 , 0.00352949, 0.04416501, 0.02231389, 0.03516453,
       0.08532633, 0.00261708, 0.00313477, 0.0252167 , 0.01115087,
       0.01610297, 0.02811479, 0.00479312, 0.00383677, 0.00866105,
       0.01563949, 0.0052264 , 0.00333935, 0.00379794, 0.00522534,
       0.01015787, 0.01360942, 0.02900932, 0.05176689, 0.00399215,
       0.01144514, 0.0095812 , 0.0154222 , 0.0168415 , 0.07855189]), 'mean_score_time': array([0.01129794, 0.01760912, 0.0269297 , 0.04188768, 0.06783303,
       0.12831823, 0.01164651, 0.01913222, 0.02795378, 0.0453968 ,
       0.07681274, 0.11271127, 0.01163594, 0.0202926 , 0.02926898,
       0.04853662, 0.078336  , 0.11386808, 0.01196702, 0.02012944,
       0.02891843, 0.04953392, 0.07670363, 0.12533696, 0.01163022,
       0.01925429, 0.02759449, 0.04856451, 0.07310772, 0.1094408 ]), 'std_score_time': array([1.21565231e-03, 4.64426949e-04, 1.40815497e-03, 8.77806426e-07,
       8.14279704e-04, 2.85228987e-02, 4.79448361e-04, 2.90959658e-04,
       7.97307765e-04, 6.99545003e-04, 8.38448756e-04, 1.41999678e-03,
       9.41111034e-04, 1.68392675e-03, 1.67678405e-03, 1.88199732e-03,
       1.20660599e-03, 2.76808664e-03, 8.13614765e-04, 2.29377756e-04,
       8.14112007e-04, 3.08379231e-03, 1.06598089e-03, 9.68575782e-03,
       4.79575098e-04, 4.60008011e-04, 1.24437035e-03, 1.69949754e-03,
       2.60600291e-03, 2.12582777e-03]), 'param_max_depth': masked_array(data=[5, 5, 5, 5, 5, 5, 8, 8, 8, 8, 8, 8, 15, 15, 15, 15, 15,
                   15, 25, 25, 25, 25, 25, 25, 30, 30, 30, 30, 30, 30],
             mask=[False, False, False, False, False, False, False, False,
                   False, False, False, False, False, False, False, False,
                   False, False, False, False, False, False, False, False,
                   False, False, False, False, False, False],
       fill_value='?',
            dtype=object), 'param_n_estimators': masked_array(data=[120, 200, 300, 500, 800, 1200, 120, 200, 300, 500, 800,
                   1200, 120, 200, 300, 500, 800, 1200, 120, 200, 300,
                   500, 800, 1200, 120, 200, 300, 500, 800, 1200],
             mask=[False, False, False, False, False, False, False, False,
                   False, False, False, False, False, False, False, False,
                   False, False, False, False, False, False, False, False,
                   False, False, False, False, False, False],
       fill_value='?',
            dtype=object), 'params': [{'max_depth': 5, 'n_estimators': 120}, {'max_depth': 5, 'n_estimators': 200}, {'max_depth': 5, 'n_estimators': 300}, {'max_depth': 5, 'n_estimators': 500}, {'max_depth': 5, 'n_estimators': 800}, {'max_depth': 5, 'n_estimators': 1200}, {'max_depth': 8, 'n_estimators': 120}, {'max_depth': 8, 'n_estimators': 200}, {'max_depth': 8, 'n_estimators': 300}, {'max_depth': 8, 'n_estimators': 500}, {'max_depth': 8, 'n_estimators': 800}, {'max_depth': 8, 'n_estimators': 1200}, {'max_depth': 15, 'n_estimators': 120}, {'max_depth': 15, 'n_estimators': 200}, {'max_depth': 15, 'n_estimators': 300}, {'max_depth': 15, 'n_estimators': 500}, {'max_depth': 15, 'n_estimators': 800}, {'max_depth': 15, 'n_estimators': 1200}, {'max_depth': 25, 'n_estimators': 120}, {'max_depth': 25, 'n_estimators': 200}, {'max_depth': 25, 'n_estimators': 300}, {'max_depth': 25, 'n_estimators': 500}, {'max_depth': 25, 'n_estimators': 800}, {'max_depth': 25, 'n_estimators': 1200}, {'max_depth': 30, 'n_estimators': 120}, {'max_depth': 30, 'n_estimators': 200}, {'max_depth': 30, 'n_estimators': 300}, {'max_depth': 30, 'n_estimators': 500}, {'max_depth': 30, 'n_estimators': 800}, {'max_depth': 30, 'n_estimators': 1200}], 'split0_test_score': array([0.79820628, 0.79820628, 0.79820628, 0.79820628, 0.79820628,
       0.79820628, 0.75784753, 0.77130045, 0.75784753, 0.76233184,
       0.75784753, 0.75784753, 0.78026906, 0.78026906, 0.78026906,
       0.78475336, 0.78475336, 0.78475336, 0.79372197, 0.78026906,
       0.78475336, 0.78475336, 0.78026906, 0.78026906, 0.78475336,
       0.78026906, 0.78026906, 0.78475336, 0.78026906, 0.78475336]), 'split1_test_score': array([0.81165919, 0.81165919, 0.81165919, 0.81165919, 0.81165919,
       0.81165919, 0.79820628, 0.80269058, 0.80269058, 0.80269058,
       0.79372197, 0.79372197, 0.79820628, 0.78026906, 0.78475336,
       0.78026906, 0.78026906, 0.78026906, 0.78026906, 0.78026906,
       0.78026906, 0.78026906, 0.78026906, 0.78026906, 0.78026906,
       0.78026906, 0.78026906, 0.78026906, 0.78026906, 0.78026906]), 'split2_test_score': array([0.83783784, 0.83783784, 0.83333333, 0.83783784, 0.83783784,
       0.81081081, 0.85135135, 0.82432432, 0.83783784, 0.83333333,
       0.83783784, 0.84684685, 0.81081081, 0.82432432, 0.82882883,
       0.82882883, 0.84684685, 0.82882883, 0.85135135, 0.84684685,
       0.82882883, 0.82882883, 0.84234234, 0.84234234, 0.82432432,
       0.81531532, 0.82432432, 0.82882883, 0.84684685, 0.82882883]), 'mean_test_score': array([0.8159011 , 0.8159011 , 0.8143996 , 0.8159011 , 0.8159011 ,
       0.80689209, 0.80246839, 0.79943845, 0.79945865, 0.79945192,
       0.79646911, 0.79947212, 0.79642872, 0.79495415, 0.79795042,
       0.79795042, 0.80395642, 0.79795042, 0.80844746, 0.80246165,
       0.79795042, 0.79795042, 0.80096015, 0.80096015, 0.79644892,
       0.79195114, 0.79495415, 0.79795042, 0.80246165, 0.79795042]), 'std_test_score': array([0.0164552 , 0.0164552 , 0.01447089, 0.0164552 , 0.0164552 ,
       0.00615156, 0.03829156, 0.02176871, 0.03273577, 0.02907656,
       0.03271363, 0.03656061, 0.01253181, 0.02076785, 0.02191095,
       0.02191095, 0.03038331, 0.02191095, 0.03083075, 0.03138507,
       0.02191095, 0.02191095, 0.02926163, 0.02926163, 0.01979572,
       0.01652096, 0.02076785, 0.02191095, 0.03138507, 0.02191095]), 'rank_test_score': array([ 1,  1,  5,  1,  1,  7,  9, 17, 15, 16, 25, 14, 27, 28, 18, 18,  8,
       18,  6, 10, 18, 18, 12, 12, 26, 30, 28, 18, 10, 18])}