01.Python Dash网页开发:环境配置和初试
Dash类似R语言中的Shiny包,可以使用纯Python代码而不需要学习HTML、CSS、JavaScript语言就可以快速搭建一个网站,dash-bootstrap-components是Dash的拓展,提供了很多特性。

official site
- Dash
https://dash.plotly.com/
- dash-bootstrap-components(dbc)
https://dash-bootstrap-components.opensource.faculty.ai/
conda环境配置
我一直使用的是micromamba,因为比conda速度快,语法和conda一样,其中Dash网站所需要的4个包名字是dash开头,其他包是平时数据分析所需要用的;这里并未指定Python版本,自动安装的python是最新版3.10。
micromamba create -n dash;micromamba activate dash
micromamba -y install -c anaconda ipywidgets pandas numpy seaborn scikit-learn
micromamba -y install -c conda-forge matplotlib ipykernel dash dash-core-components dash-html-components dash-bootstrap-components
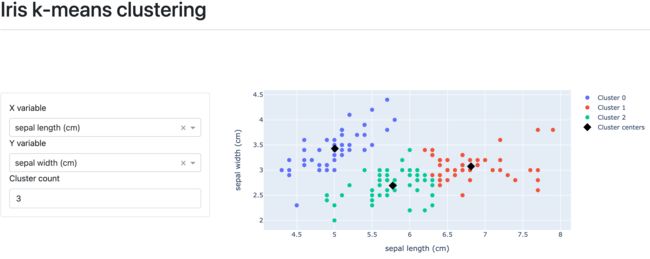
Dash网页APP初试
这里使用的是dbc官网的案例,模仿Shiny包使用KMeans给iris数据集聚类。
先不用管代码怎么写的,先跑起来。
新进一个文件iris_dash.py把下边代码复制进去。
"""
Dash port of Shiny iris k-means example:

https://shiny.rstudio.com/gallery/kmeans-example.html
"""
import dash
import dash_bootstrap_components as dbc
import pandas as pd
import plotly.graph_objs as go
from dash import Input, Output, dcc, html
from sklearn import datasets
from sklearn.cluster import KMeans

iris_raw = datasets.load_iris()
iris = pd.DataFrame(iris_raw["data"], columns=iris_raw["feature_names"])

app = dash.Dash(external_stylesheets=[dbc.themes.BOOTSTRAP])

controls = dbc.Card(
    [
        html.Div(
            [
                dbc.Label("X variable"),
                dcc.Dropdown(
                    id="x-variable",
                    options=[
                        {"label": col, "value": col} for col in iris.columns
                    ],
                    value="sepal length (cm)",
                ),
            ]
        ),
        html.Div(
            [
                dbc.Label("Y variable"),
                dcc.Dropdown(
                    id="y-variable",
                    options=[
                        {"label": col, "value": col} for col in iris.columns
                    ],
                    value="sepal width (cm)",
                ),
            ]
        ),
        html.Div(
            [
                dbc.Label("Cluster count"),
                dbc.Input(id="cluster-count", type="number", value=3),
            ]
        ),
    ],
    body=True,
)

app.layout = dbc.Container(
    [
        html.H1("Iris k-means clustering"),
        html.Hr(),
        dbc.Row(
            [
                dbc.Col(controls, md=4),
                dbc.Col(dcc.Graph(id="cluster-graph"), md=8),
            ],
            align="center",
        ),
    ],
    fluid=True,
)


@app.callback(
    Output("cluster-graph", "figure"),
    [
        Input("x-variable", "value"),
        Input("y-variable", "value"),
        Input("cluster-count", "value"),
    ],
)
def make_graph(x, y, n_clusters):
    # minimal input validation, make sure there's at least one cluster
    km = KMeans(n_clusters=max(n_clusters, 1))
    df = iris.loc[:, [x, y]]
    km.fit(df.values)
    df["cluster"] = km.labels_

    centers = km.cluster_centers_

    data = [
        go.Scatter(
            x=df.loc[df.cluster == c, x],
            y=df.loc[df.cluster == c, y],
            mode="markers",
            marker={"size": 8},
            name="Cluster {}".format(c),
        )
        for c in range(n_clusters)
    ]

    data.append(
        go.Scatter(
            x=centers[:, 0],
            y=centers[:, 1],
            mode="markers",
            marker={"color": "#000", "size": 12, "symbol": "diamond"},
            name="Cluster centers",
        )
    )

    layout = {"xaxis": {"title": x}, "yaxis": {"title": y}}

    return go.Figure(data=data, layout=layout)


# make sure that x and y values can't be the same variable
def filter_options(v):
    """Disable option v"""
    return [
        {"label": col, "value": col, "disabled": col == v}
        for col in iris.columns
    ]


# functionality is the same for both dropdowns, so we reuse filter_options
app.callback(Output("x-variable", "options"), [Input("y-variable", "value")])(
    filter_options
)
app.callback(Output("y-variable", "options"), [Input("x-variable", "value")])(
    filter_options
)


if __name__ == "__main__":
    app.run_server(debug=True, port=8888)
在terminal中运行
micromamba activate dash
python iris_dash.py
打开浏览器http://127.0.0.1:8888/#,一个交互式网页APP就OK了。
教程
收集的一些教程,开始学吧~
当然,官网也是很好的教程。
https://mp.weixin.qq.com/s/7WTNWuALtWKE8dmW6AIGDw
https://study.163.com/course/introduction.htm?courseId=1209894808
https://blog.csdn.net/yuetaope/article/details/121407096
https://blog.csdn.net/l782060902/article/details/121950206
本文由mdnice多平台发布