介绍 (Introduction)
In this article, we will take a look at an alternative approach to K Means clustering, popularly known as the Hierarchical Clustering. The hierarchical Clustering technique differs from K Means or K Mode, where the underlying algorithm of how the clustering mechanism works is different. K Means relies on a combination of centroid and euclidean distance to form clusters, hierarchical clustering on the other hand uses agglomerative or divisive techniques to perform clustering. Hierarchical clustering allows visualization of clusters using dendrograms that can help in better interpretation of results through meaningful taxonomies. Creating a dendrogram doesn’t require us to specify the number of clusters upfront.
在本文中,我们将介绍K均值聚类的另一种方法,通常称为“层次聚类”。 分层聚类技术不同于K均值或K模式,后者的聚类机制如何工作的基础算法不同。 K Means依靠质心和欧几里得距离的组合来形成聚类,另一方面,层次聚类则使用凝聚或分裂技术进行聚类。 分层聚类允许使用树状图可视化聚类,这有助于通过有意义的分类法更好地解释结果。 创建树状图不需要我们预先指定群集数。
Programming languages like R, Python, and SAS allow hierarchical clustering to work with categorical data making it easier for problem statements with categorical variables to deal with.
诸如R,Python和SAS之类的编程语言允许分层聚类与分类数据一起使用,从而使带有分类变量的问题陈述更易于处理。
层次聚类中的重要术语 (Important Terms in Hierarchical Clustering)
链接方法 (Linkage Methods)
Suppose there are (a) original observations a[0],…,a[|a|−1] in cluster (a) and (b) original objects b[0],…,b[|b|−1] in cluster (b), then in order to combine these clusters we need to calculate the distance between two clusters (a) and (b). Say a point (d) exists that hasn’t been allocated to any of the clusters, we need to compute the distance between cluster (a) to (d) and between cluster (b) to (d).
假设在群集(a)中有(a)个原始观测值a [0],…,a [| a | -1],在(b)中有(b)个原始对象b [0],…,b [| b | -1]聚类(b),然后为了合并这些聚类,我们需要计算两个聚类(a)和(b)之间的距离。 假设存在尚未分配给任何群集的点(d),我们需要计算群集(a)至(d)之间以及群集(b)至(d)之间的距离。
Now clusters usually have multiple points in them that require a different approach for the distance matrix calculation. Linkage decides how the distance between clusters, or point to cluster distance is computed. Commonly used linkage mechanisms are outlined below:
现在,群集中通常具有多个点,因此需要不同的距离矩阵计算方法。 链接决定如何计算聚类之间的距离或点到聚类的距离。 常用的链接机制概述如下:
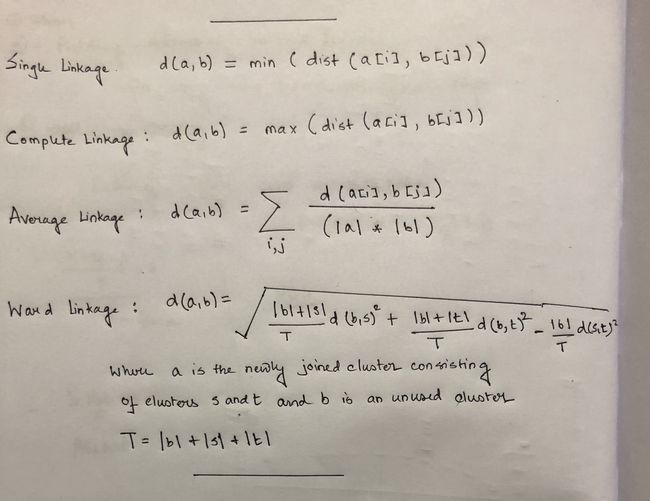
- Single Linkage — Distances between the most similar members for each pair of clusters are calculated and then clusters are merged based on the shortest distance 单一链接-计算每对集群中最相似成员之间的距离,然后根据最短距离合并集群
- Average Linkage — Distance between all members of one cluster is calculated to all other members in a different cluster. The average of these distances is then utilized to decide which clusters will merge 平均链接-计算一个群集中所有成员到另一群集中所有其他成员之间的距离。 然后,利用这些距离的平均值来确定哪些聚类将合并
- Complete Linkage — Distances between the most dissimilar members for each pair of clusters are calculated and then clusters are merged based on the shortest distance 完整链接-计算每对集群中最不相似的成员之间的距离,然后根据最短距离合并集群
- Median Linkage — Similar to the average linkage, but instead of using the average distance, we utilize the median distance 中值链接—与平均链接类似,但我们不使用平均距离,而是使用中值距离
- Ward Linkage — Uses the analysis of variance method to determine the distance between clusters 病房链接—使用方差分析方法确定聚类之间的距离
- Centroid Linkage — Calculates the centroid of each cluster by taking the average of all points assigned to the cluster and then calculates the distance to other clusters using this centroid 质心链接—通过获取分配给该群集的所有点的平均值来计算每个群集的质心,然后使用该质心计算到其他群集的距离
These formulas for distance calculation is illustrated in Figure 1 below.
这些用于距离计算的公式如下图1所示。
距离计算 (Distance Calculation)
Distance between two or more clusters can be calculated using multiple approaches, the most popular being Euclidean Distance. However, other distance metrics like Minkowski, City Block, Hamming, Jaccard, Chebyshev, etc. can also be used with hierarchical clustering. Figure 2 below outlines how hierarchical clustering is influenced by different distance metrics.
可以使用多种方法来计算两个或多个聚类之间的距离,最流行的是欧几里得距离。 但是,其他距离度量标准(例如Minkowski,City Block,Hamming,Jaccard,Chebyshev等)也可以与层次聚类一起使用。 下面的图2概述了层次聚类如何受到不同距离度量的影响。
树状图 (Dendrogram)
A dendrogram is used to represent the relationship between objects in a feature space. It is used to display the distance between each pair of sequentially merged objects in a feature space. Dendrograms are commonly used in studying the hierarchical clusters before deciding the number of clusters appropriate to the dataset. The distance at which two clusters combine is referred to as the dendrogram distance. The dendrogram distance is a measure of if two or more clusters are disjoint or can be combined to form one cluster together.
树状图用于表示特征空间中对象之间的关系。 它用于显示特征空间中每对顺序合并的对象之间的距离。 在确定适合数据集的聚类数量之前,树状图通常用于研究层次聚类。 两个簇组合的距离称为树状图距离。 树状图距离是两个或更多簇不相交或可以组合在一起形成一个簇的度量。


态系数 (Cophenetic Coefficient)
Figures 3, 4, and 5 above signify how the choice of linkage impacts the cluster formation. Visually looking into every dendrogram to determine which clustering linkage works best is challenging and requires a lot of manual effort. To overcome this we introduce the concept of Cophenetic Coefficient.
上面的图3、4和5表示连接的选择如何影响簇的形成。 目视检查每个树状图以确定哪种聚类链接最有效是一项挑战,需要大量的人工。 为了克服这个问题,我们引入了Cophenetic Coefficient的概念。
Imagine two Clusters, A and B with points A₁, A₂, and A₃ in Cluster A and points B₁, B₂, and B₃ in cluster B. Now for these two clusters to be well-separated points A₁, A₂, and A₃ and points B₁, B₂, and B₃ should be far from each other as well. Cophenet index is a measure of the correlation between the distance of points in feature space and distance on the dendrogram. It usually takes all possible pairs of points in the data and calculates the euclidean distance between the points. (remains the same, irrespective of which linkage algorithm we chose). It then computes the dendrogram distance at which clusters A & B combines. If the distance between these points increases with the dendrogram distance between the clusters then the Cophenet index is closer to 1.
想象一下两个群集A和B,群集A中的点A 1,A 2和A 1,群集B中的B 1,B 2和B 1点。现在,这两个群集是点A 1,A 2和A 3以及点B 1完全分离的,B 2和B 1也应该彼此远离。 Cophenet索引是度量特征空间中的点的距离与树状图上的距离之间的相关性的量度。 通常,它会获取数据中所有可能的点对,并计算这些点之间的欧式距离。 (无论我们选择哪种链接算法,都保持不变)。 然后,计算群集A和B合并的树状图距离。 如果这些点之间的距离随簇之间的树状图距离而增加,则Cophenet指数更接近1。
确定群集数 (Deciding the Number of Clusters)
There are no statistical techniques to decide the number of clusters in hierarchical clustering, unlike a K Means algorithm that uses an elbow plot to determine the number of clusters. However, one common approach is to analyze the dendrogram and look for groups that combine at a higher dendrogram distance. Let’s take a look at the example below.
与使用弯头图确定簇数的K Means算法不同,没有统计技术可以确定层次聚类中的簇数。 但是,一种常见的方法是分析树状图,并寻找在更大的树状图距离处合并的组。 让我们看下面的例子。

Figure 7 illustrates the presence of 5 clusters when the tree is cut at a Dendrogram distance of 3. The general idea being, all 5 groups of clusters combines at a much higher dendrogram distance and hence can be treated as individual groups for this analysis. We can also verify the same using a silhouette index score.
图7说明了在树形图距离为3的情况下切割树时存在5个聚类。一般的想法是,所有5组聚类在更高的树形图距离处合并,因此可以作为该分析的单个组。 我们还可以使用轮廓索引分数来验证相同的结果。
结论 (Conclusion)
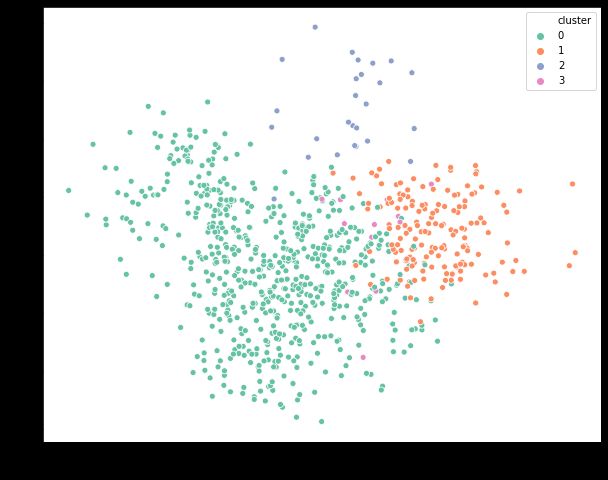
Deciding the number of clusters in any clustering exercise is a tedious task. Since the commercial side of the business is more focused on getting some meaning out of these groups, it is important to visualize the clusters in a two-dimensional space and check if they are distinct from each other. This can be achieved via PCA or Factor Analysis. This is a widely used mechanism to present the final results to different stakeholders that makes it easier for everyone to consume the output.
确定任何聚类活动中的聚类数量是一项繁琐的任务。 由于业务的商业方面更专注于从这些组中获取一些含义,因此在二维空间中可视化群集并检查它们是否彼此不同非常重要。 这可以通过PCA或因子分析来实现。 这是一种广泛使用的机制,可以将最终结果呈现给不同的利益相关者,使每个人都更容易使用输出。
About the Author: Advanced analytics professional and management consultant helping companies find solutions for diverse problems through a mix of business, technology, and math on organizational data. A Data Science enthusiast, here to share, learn and contribute; You can connect with me on Linked and Twitter;
作者简介:高级分析专家和管理顾问,通过组织数据的业务,技术和数学相结合,帮助公司找到各种问题的解决方案。 数据科学爱好者,在这里分享,学习和贡献; 您可以在 Linked 和 Twitter上 与我 联系 ;
翻译自: https://towardsdatascience.com/hierarchical-clustering-in-python-using-dendrogram-and-cophenetic-correlation-8d41a08f7eab