可视化 | Python绘制精美仪表盘
文章目录
- 1. 准备工作
-
- 1.1 pyechars安装
- 1.2 导入模块
- 2. 绘制仪表盘
-
- 2.1 基本仪表盘
- 2.2 改变刻度盘半径,去掉文字标签
- 2.3 改变刻度盘颜色
- 2.4 纯数字显示标签
- 2.5 速度仪表盘
- 推荐阅读
大家好,我是欧K。
仪表盘是一种拟物化图表,比如我们平时看到的水表,气压表,时速表等,可以很直观的观测数据和设备状态。本期给大家分享如何使用python绘制仪表盘,希望对你有所帮助。
1. 准备工作
1.1 pyechars安装
这里有两种安装方法:
# 方法1
pip install pyecharts

# 方法2
pip install -i https://pypi.tuna.tsinghua.edu.cn/simple/ pyecharts
1.2 导入模块
from pyecharts import options as opts
from pyecharts.charts import Gauge
2. 绘制仪表盘
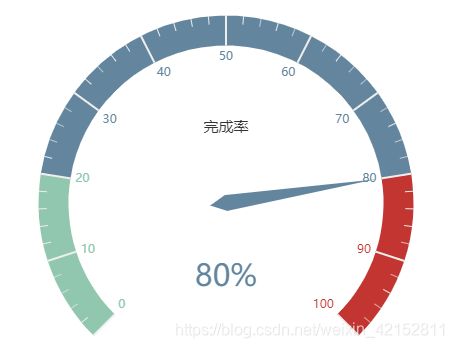
2.1 基本仪表盘
代码:
c1 = (
    Gauge()
    .add('',
         [("完成率", 80)])
    .set_global_opts(
        title_opts=opts.TitleOpts(title='基本仪表盘'),
        legend_opts=opts.LegendOpts(is_show=False),
    )
    .render("gauge_base.html")
)
add函数部分参数:
def add(
    # 系列名称,用于 tooltip 的显示,legend 的图例筛选。
    series_name: str,

    # 系列数据项,格式为 [(key1, value1), (key2, value2)]
    data_pair: Sequence,

    # 是否选中图例
    is_selected: bool = True,

    # 最小的数据值
    min_: Numeric = 0,

    # 最大的数据值
    max_: Numeric = 100,

    # 仪表盘平均分割段数
    split_number: Numeric = 10,

    # 仪表盘半径,可以是相对于容器高宽中较小的一项的一半的百分比,也可以是绝对的数值。
    radius: types.Union[types.Numeric, str] = "75%",

    # 仪表盘起始角度。圆心 正右手侧为0度,正上方为 90 度,正左手侧为 180 度。
    start_angle: Numeric = 225,

    # 仪表盘结束角度。
    end_angle: Numeric = -45,

    # 仪表盘刻度是否是顺时针增长。
    is_clock_wise: bool = True,

    # 轮盘内标题文本项标签配置项,参考 `chart_options.GaugeTitleOpts`
    title_label_opts: types.GaugeTitle = opts.GaugeTitleOpts(),

    # 轮盘内数据项标签配置项,参考 `chart_options.GaugeDetailOpts`
    detail_label_opts: types.GaugeDetail = opts.GaugeDetailOpts(formatter="{value}%"),

    # 仪表盘指针配置项目,参考 `chart_options.GaugePointerOpts`
    pointer: types.GaugePointer = opts.GaugePointerOpts(),

    # 提示框组件配置项,参考 `series_options.TooltipOpts`
    tooltip_opts: Union[opts.TooltipOpts, dict, None] = None,

    # 图元样式配置项,参考 `series_options.ItemStyleOpts`
    itemstyle_opts: Union[opts.ItemStyleOpts, dict, None] = None,
)
2.2 改变刻度盘半径,去掉文字标签
代码:
c2 = (
    Gauge()
    .add('', [('', 80)], radius='50%')
    .set_global_opts(title_opts=opts.TitleOpts(title="Gauge-修改 Radius 为 50%"))
    .render('gauge_change_radius.html')
)
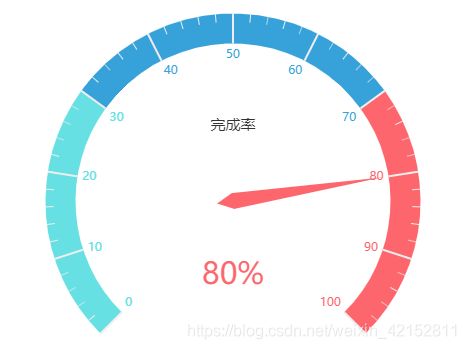
2.3 改变刻度盘颜色
代码:
c3 = (
    Gauge()
    .add(
        '',
        [('完成率', 80)],
        axisline_opts=opts.AxisLineOpts(
            linestyle_opts=opts.LineStyleOpts(
                color=[(0.3, '#67e0e3'), (0.7, '#37a2da'), (1, '#fd666d')], width=30
            )
        ),
    )
    .set_global_opts(
        title_opts=opts.TitleOpts(title='改变刻度盘颜色'),
        legend_opts=opts.LegendOpts(is_show=False),
    )
    .render('gauge_color.html')
)
以三段为例,可根据需要自行扩展color参数列表大小。
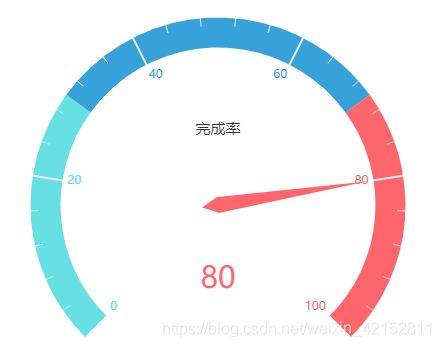
2.4 纯数字显示标签
代码:
c4 = (
    Gauge()
    .add(
        '',
        [('完成率', 80)],
        split_number=5,
        axisline_opts=opts.AxisLineOpts(
            linestyle_opts=opts.LineStyleOpts(
                color=[(0.3, "#67e0e3"), (0.7, "#37a2da"), (1, "#fd666d")], width=30
            )
        ),
        detail_label_opts=opts.LabelOpts(formatter='{value}'),
    )
    .set_global_opts(
        title_opts=opts.TitleOpts(title='纯数字显示'),
        legend_opts=opts.LegendOpts(is_show=False),
    )
    .render("gauge_splitnum_label.html")
)
2.5 速度仪表盘
代码:
c5 = (
    Gauge()
    .add(
        '',
        [('时速(Km/h)', 110)],
        split_number=5,
        min_ = 0, #最小刻度
        max_ = 120, #最大刻度
        detail_label_opts=opts.LabelOpts(is_show=False),
    )
    .set_global_opts(
        title_opts=opts.TitleOpts(title='时速表'),
        legend_opts=opts.LegendOpts(is_show=False),
    )
    .render("gauge_speed.html")
)
完。
以上就是本期为大家整理的全部内容了,赶快练习起来吧,原创不易,喜欢的朋友可以点赞、收藏也可以分享让更多人知道哦
推荐阅读
基础 | Python面向对象一文详解
基础 | Python函数一文详解
技巧 | 20个Pycharm最实用最高效的快捷键(动态展示)
技巧 | 5000字超全解析Python三种格式化输出方式【% / format / f-string】
爬虫 | Python送你王者荣耀官网全套皮肤
爬虫 | 用python构建自己的IP代理池,再也不担心IP不够用啦!
可视化 | Python制作最炫3D可视化地图
可视化 | 动起来的中国大学排名,看看你的母校在哪里
微信公众号 “Python当打之年” ,每天都有python编程技巧推送,希望大家可以喜欢
![]()


