算法设计与智能计算 || 专题五: 最优解搜索问题
最优解搜索问题
文章目录
- 最优解搜索问题
-
- 1. 牛顿迭代法
-
- 1.1 牛顿分搜索零点的原理
- 1.2 牛顿法搜索极值点原理
- 2. 梯度下降法
-
- 2.1 微分与梯度
-
- 2.1.1 一元函数与多元函数的微分
- 2.1.2 梯度
- 2.3 梯度下降法
- 2.4 案例分析
- 例子
1. 牛顿迭代法
1.1 牛顿分搜索零点的原理
牛顿法是基于泰勒公式来实现的。泰勒公式的意义:如果函数满足一定的条件,泰勒公式可以用函数在某一点的各阶导数值做系数构建一个多项式来近似表达这个函数。
已经证明,如果是连续的,并且待求的零点是孤立的,那么在零点周围存在一个区域,只要初始值位于这个邻近区域内,那么牛顿法必定收敛。 并且,如果不为0, 那么牛顿法将具有平方收敛的性能. 粗略的说,这意味着每迭代一次,牛顿法结果的有效数字将增加一倍。
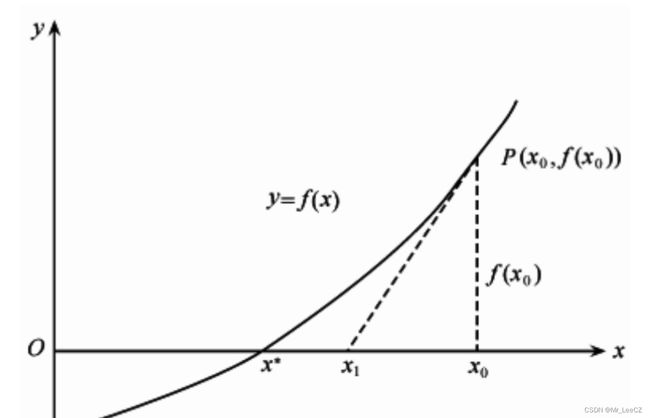
3 牛顿法的几何解释
牛顿法的迭代过程如下:
import numpy as np
import matplotlib.pyplot as plt

def f(w):
    return w ** 2

x, y = [], []
eta, epsilon = 0.1, 0.01
w = -1.5
while abs(f(w)) > epsilon:
    x.append(w)
    y.append(f(w))
    w = w - f(w) / (2 * w)

W = np.linspace(-2, 2, 100).reshape(100, 1)
u = f(W)
plt.plot(W, u)
plt.scatter(x, y)
plt.show()

'''
eta, epsilon = 0.1, 0.01
w = 0
while abs(2 * (w - 1)) > epsilon:
    w = w - eta * 2 * (w - 1)
print(w)
'''
1.2 牛顿法搜索极值点原理
w ( t + 1 ) = w ( t ) − f ′ ( w ( t ) ) f ′ ′ ( w ( t ) ) w^{(t+1)}=w^{(t)}-\frac{f'(w^{(t)})}{f''(w^{(t)})} w(t+1)=w(t)−f′′(w(t))f′(w(t))
def F(w):
    return w ** 2 - w + 1

def dF(w):
    return 2 * w - 1

epsilon = 0.01
w = 0
while abs(dF(w)) > epsilon:
    w = w - dF(w) / 2
print(w)

'''
eta, epsilon = 0.1, 0.01
w = 0
while abs(2 * (w - 1)) > epsilon:
    w = w - eta * 2 * (w - 1)
print(w)
'''
2. 梯度下降法
梯度下降(gradient descent)在机器学习中应用十分的广泛,不论是在线性回归还是Logistic回归中,它的主要目的是通过迭代找到目标函数的最小值,或者收敛到最小值。
梯度下降法的基本思想可以类比为一个下山的过程。假设这样一个场景:一个人被困在山上,需要从山上下来(找到山的最低点,也就是山谷)。但此时山上的浓雾很大,导致可视度很低;因此,下山的路径就无法确定,必须利用自己周围的信息一步一步地找到下山的路。这个时候,便可利用梯度下降算法来帮助自己下山。怎么做呢,首先以他当前的所处的位置为基准,寻找这个位置最陡峭的地方,然后朝着下降方向走一步,然后又继续以当前位置为基准,再找最陡峭的地方,再走直到最后到达最低处;同理上山也是如此,只是这时候就变成梯度上升算法了。
2.1 微分与梯度
梯度与微分十分相似,但又有本质的区别和物理含义的不同。
2.1.1 一元函数与多元函数的微分
一元函数微分
d ( 5 − θ ) 2 d θ = − 2 ( 5 − θ ) = 2 θ − 10 \frac{d(5-\theta)^2}{d\theta}=-2(5-\theta)=2\theta-10 dθd(5−θ)2=−2(5−θ)=2θ−10
多元函数微分
∂ ( 5 θ 1 − 12 θ 2 ) ∂ θ 1 = 5 \frac{\partial(5\theta_1-12\theta_2)}{\partial\theta_1}=5 ∂θ1∂(5θ1−12θ2)=5
∂ ( 5 θ 1 − 12 θ 2 ) ∂ θ 2 = − 12 \frac{\partial(5\theta_1-12\theta_2)}{\partial\theta_2}=-12 ∂θ2∂(5θ1−12θ2)=−12
2.1.2 梯度
梯度实际上就是多变量微分的一般化。
J ( θ 1 , θ 2 ) = 5 θ 1 − 12 θ 2 J(\theta_1,\theta_2)=5\theta_1-12\theta_2 J(θ1,θ2)=5θ1−12θ2
梯度为
∇ J ( θ 1 , θ 2 ) = ( ∂ J ( θ 1 , θ 2 ) ∂ θ 1 , ∂ J ( θ 1 , θ 2 ) ∂ θ 2 ) ⊤ = ( 5 , − 12 ) ⊤ \nabla J(\theta_1,\theta_2)=(\frac{\partial J(\theta_1,\theta_2)}{\partial\theta_1},\frac{\partial J(\theta_1,\theta_2)}{\partial\theta_2})^\top=(5,-12)^\top ∇J(θ1,θ2)=(∂θ1∂J(θ1,θ2),∂θ2∂J(θ1,θ2))⊤=(5,−12)⊤
2.3 梯度下降法
import numpy as np
import matplotlib.pyplot as plt


def y(x):  # 定义函数,求函数的极小值
    y = (x-10)*(x-10) + 10*np.sin(x) - 3*x +60
    return y


def dy(x):  # 函数y(x)的导数
    dy = 2*(x-10) + 10*np.cos(x) -3
    return dy


def gradient_descent(x0, a, d0):  # 梯度下降法,x0为初始值,a为学习率,d0为算法的收敛条件
    x = np.linspace(0, 20, 40)
    plt.figure()
    plt.plot(x, y(x), label='y(x)')
    plt.legend(loc='best')
    plt.xlabel("x")
    plt.ylabel("y")
    for i in range(1000):  # 迭代1000次,无论是否收敛都将终止程序
        plt.scatter(x0, y(x0), c='red', marker='o', label='x0')
        d = y(x0) - y(x0-a*dy(x0))
        if d < d0:  # 判断是否满足收敛条件
            break
        else:
            x0 = x0 - a*dy(x0)  # x0通过梯度更新,下降最快
    plt.grid()
    plt.show()
    return x0, y(x0)


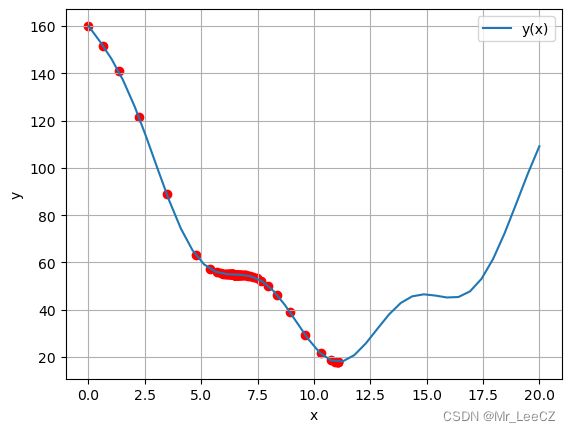
x1, y1 = gradient_descent(0, 0.05, 0.0001)

print("当x={}时".format(x1) + ", y(x)取全局最小值{}".format(y(x1)))

当x=11.076141044662462时, y(x)取全局最小值17.96209387410127
2.4 案例分析
class LINEAR_REGRESSION:
    def __init__(self,alpha=0.01):
        self.alpha = alpha

    # 定义代价函数
    def cost_function(self, theta, X, Y):
        diff = np.dot(X, theta) - Y  # dot() 数组需要像矩阵那样相乘,就需要用到dot()
        return (1/(2*m)) * np.dot(diff.transpose(), diff)


    # 定义代价函数对应的梯度函数
    def gradient_function(self, theta, X, Y):
        diff = np.dot(X, theta) - Y
        return (1/m) * np.dot(X.transpose(), diff)

    # 梯度下降迭代
    def fit(self, X, Y):
        theta = np.array([1, 1]).reshape(2, 1)
        gradient = self.gradient_function(theta, X, Y)
        while not all(abs(gradient) <= 1e-5):
            theta = theta - self.alpha * gradient
            gradient = self.gradient_function(theta, X, Y)
        return theta

    # 根据数据画出对应的图像
    def plot(self,X, Y, theta):
        ax = plt.subplot(111)  # 这是我改的
        ax.scatter(X, Y, s=30, c="red", marker="s")
        plt.xlabel("X")
        plt.ylabel("Y")
        x = np.arange(0, 21, 0.2)  # x的范围
        y = theta[0] + theta[1]*x
        ax.plot(x, y)
        plt.show()
import numpy as np
import matplotlib.pyplot as plt

if __name__ == "__main__":
    # 数据集大小 即20个数据点
    m = 20
    # x的坐标以及对应的矩阵
    X0 = np.ones((m, 1))  # 生成一个m行1列的向量,也就是x0,全是1
    X1 = np.arange(1, m+1).reshape(m, 1)  # 生成一个m行1列的向量,也就是x1,从1到m
    X = np.hstack((X0, X1))  # 按照列堆叠形成数组,其实就是样本数据
    # 对应的y坐标
    y = np.array([
        3, 4, 5, 5, 2, 4, 7, 8, 11, 8, 12,
        11, 13, 13, 16, 17, 18, 17, 19, 21
    ]).reshape(m, 1)

    plt.scatter(X[:,1],y)
    plt.show()

    model = LINEAR_REGRESSION()
    optimal = model.fit(X,y)
    model.plot(X1, y, optimal)
    plt.show()
例子
import numpy as np

class Lin_Reg_GD:
    def __init__(self,eta=0.01,epsilon=0.01):
        self.eta = eta
        self.epsilon = epsilon
        self.maxIter = 1000

    def fit(self, X, y):
        m, n = X.shape
        w = np.zeros((n,1))
        step = 0
        while True:
            e = X.dot(w) - y
            g = 2 * X.T.dot(e) / m
            w = w - self.eta * g
            step = step + 1
            if np.linalg.norm(g, 2) < self.epsilon:
                break
        self.w = w

    def predict(self, X):
        return X.dot(self.w)
import numpy as np
from sklearn.datasets import fetch_california_housing
from sklearn.model_selection import train_test_split
from sklearn.preprocessing import StandardScaler
from sklearn.metrics import mean_squared_error
from sklearn.metrics import r2_score

def process_features(X):
    scaler = StandardScaler()
    X = scaler.fit_transform(X)
    m, n = X.shape
    X = np.c_[np.ones((m, 1)), X]
    return X

housing = fetch_california_housing()
X = housing.data
y = housing.target.reshape(-1,1)
X_train, X_test, y_train, y_test = train_test_split(X, y, test_size=0.2, random_state=0)
X_train = process_features(X_train)
X_test = process_features(X_test)

model = Lin_Reg_GD()
model.fit(X_train, y_train)
y_pred = model.predict(X_test)
mse = mean_squared_error(y_test, y_pred)
score = r2_score(y_test, y_pred)
print("mse = {}, r2 = {}".format(mse, score))


