【数据可视化】案例一:美国人口与种族变迁史
实验介绍
作为一个移民国家,美国的种族和人口问题全方位地影响着美国各州的政治、经济、文化和司法,本实验通过对美国人口普查局与美国国家卫生统计中心自 1990 以来调查获得的长达 29 年的美国人口和种族数据的分析,研究及可视化了美国在此期间的人口和种族的变迁史。
知识点
- 散点图接口及其参数的使用
- 漏斗图的绘制
- 画布上多子图的绘制
- 散点图的数据拟合
- 颜色条的绘制和应用
- 数据对数变换技巧
输入并执行魔法命令 %matplotlib inline, 同时将全局字体大小设置为 20 号,设置显示负数,去除图例边框、右侧坐标轴、顶部坐标轴。
import warnings
import matplotlib.pyplot as plt
%matplotlib inline

# 屏蔽代码运行过程中出现的警告信息,主要是屏蔽 pandas 的 .loc 警告问题
warnings.filterwarnings("ignore")

# 将全局字体大小设置为 20 号
fontsize = 20
plt.rcParams['xtick.labelsize'] = fontsize
plt.rcParams['ytick.labelsize'] = fontsize
plt.rcParams['axes.labelsize'] = fontsize
plt.rcParams['axes.titlesize'] = fontsize
plt.rcParams['legend.fontsize'] = fontsize

plt.rcParams['legend.frameon'] = False  # 去除图例边框
plt.rcParams['axes.unicode_minus'] = False  # 显示负数
plt.rcParams['axes.spines.right'] = False  # 去除右侧坐标轴
plt.rcParams['axes.spines.top'] = False  # 去除顶部坐标轴
数据准备
数据集介绍:
本数据集来源于美国人口普查局与美国国家卫生统计中心,该数据集统计了美国自 1990 至 2019 年期间,各年度全美 51 州各年度性别(Gender)、种族(Race)、年龄段(Age Group)的人口数(Population),数据集中的 Mean Age 字段根据 Age Group 求算术平均得到。
导入数据并查看前 5 行。
import pandas as pd

df = pd.read_csv('https://labfile.oss.aliyuncs.com/courses/3023/American_Race_Gender_Population.csv')
df.head()
| Age Group | State | Gender | Race | Year | Population | Mean Age | |
|---|---|---|---|---|---|---|---|
| 0 | 1-4 | Alabama | Female | American Indian or Alaska Native | 1990 | 419.0 | 2.5 |
| 1 | 1-4 | Alabama | Female | American Indian or Alaska Native | 1991 | 445.0 | 2.5 |
| 2 | 1-4 | Alabama | Female | American Indian or Alaska Native | 1992 | 379.0 | 2.5 |
| 3 | 1-4 | Alabama | Female | American Indian or Alaska Native | 1993 | 344.0 | 2.5 |
| 4 | 1-4 | Alabama | Female | American Indian or Alaska Native | 1994 | 352.0 | 2.5 |
各州各种族人口数分布
本实验主要用到的可视化对象为散点图,散点图是继条形图后,用作描述性统计、数据挖掘、数据预测的第二大类可视化图形,图元素主要包括点的位置,点的形状和点的大小。
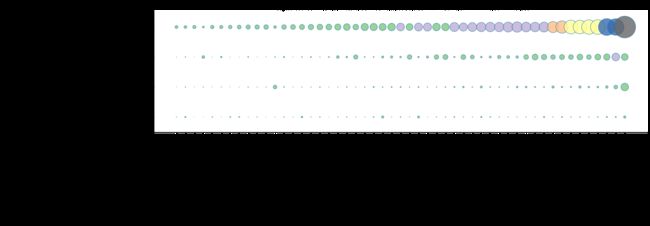
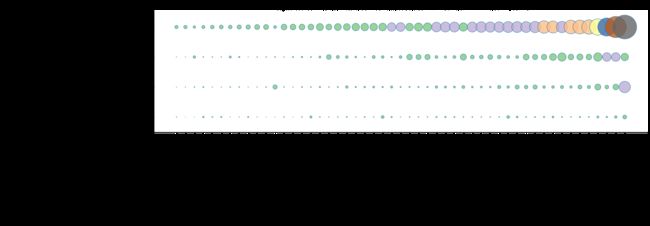
选择 1990 和 2019 两个年份,将数据集按照州(State)、种族(Race)进行人口数(Population)聚合并按照人口数升序排序。聚合后,将聚合数据集中的 State、Race 特征分别映射至散点图 x、y 坐标,将 Population 人口数特征映射至点的颜色(c)和大小(s)。
plt.rcParams['figure.figsize'] = (20, 5)  # 图像显示大小

for year in [1990, 2019]:
    data = df.loc[df['Year'] == year]  # df.loc() 根据行/列的标签进行查询

    # 各州按照总人口数升序排序
    state_order = data.groupby(['State'])[  # 按列State进行分组,按Population数据列的和进行升序排序
        'Population'].sum().sort_values().index    # 取出排序后的序号
    # 将 State 字段设置为有序字段
    data['State'] = data['State'].astype(   # astype函数用于将数据类型转换成指定类型。
        pd.api.types.CategoricalDtype(state_order, ordered=True))
# pandas.api.types.CategoricalDtype(categories = None, ordered = None) :该类对于指定独立于数值的分类数据的类型很有用,有类别和顺序。

    # 获取州、种族的聚合结果,并按州升序排序
    data = data.groupby(['State', 'Race'], as_index=False)[ # 按列'State', 'Race'进行分组,求出人口总数,按State数据列的和进行升序排序
        'Population'].sum().sort_values(['State'])

    plt.scatter(
        x=data['State'],  # x轴为州
        y=data['Race'],   # y轴为种族
        c=data['Population'],           # 点的颜色,按人口的多少来划分
        s=data['Population']*0.0001,    # 点的大小:根据画出来的图的情况进行调节
        ec='tab:blue',       #
        cmap=plt.cm.Accent,  # cmap相当于多个调色盘的合集。当选取一个色盘(viridis)后,从参数c获取到的数值,映射到色盘对应的颜色上。
        alpha=0.8)   # alpha:散点的透明度([0, 1]之间的数,0表示完全透明,1则表示完全不透明)。

    ax = plt.gca()  # gca()进行坐标轴的移动
    ax.tick_params(axis='x', rotation=90) # 将x轴刻度标签逆时针旋转90度
    ax.set_ylim(-0.5, 3.5) # 调节y轴显示范围

    plt.title('Population Distribution of States of American in Year %d' % year)
    plt.show()  # 关闭当前图层以绘制下一幅图
从输出结果可以看出:
- 各州人口数。根据 2019 年统计数据,美国人口数最多的三个州分别为 California、Texas、Florida;
- 种族人口数。美国人口种族分布上,白人(White)显著地占据着主体地位,排名第二的种族为 黑人(Black or African American),随后是亚裔(Asian or Pacific Islander);
- 各州人口变迁。对比 1990 年与 2019 年,按照人口数排序后的 x 轴,可以发现 29 年间,美国各州表现出不同速率的人口增长率,1990 年总人数排名第二的 New York 已悄然在 2019 年排名第四。
人口与人口增长率
提取数据集中 1990 和 2019 两年的数据,通过数据透视计算各州人口增长率(Pupulation Changed %),通过数据聚合计算各州 2019 年总人口数(Population),将上述分步计算结果合并并挑选需要的特征后查看前 5 行。
# 取出指定列'Year'的1990和2019数据
data = df.loc[(df['Year'] == 1990) | (df['Year'] == 2019)]

# 计算美国各州人口增长率
pop_change = data.pivot_table(
    index='State', columns='Year', values='Population',aggfunc='sum')
# values:要做计算的数据 ,对谁求和/求均值/计算个数等
# index:确定行参数,可以是多个。单个’‘,多个[’‘,’‘]表示
# columns:确定列参数,可以是多个。单个’‘,多个[’‘,’']
# aggfunc:要计算的函数,mean求均值、sum求和、size计算个数
pop_change['Pupulation Changed/%'] = 100 * \            # 加上一列'Pupulation Changed/%'
    (pop_change[2019]-pop_change[1990])/pop_change[1990]
pop_change

# 计算美国2019年各州总人口数
pop = df.loc[df['Year'] == 2019].groupby(['State'])['Population'].sum()

# # 将人口增长率与白人增长率数据合并并筛选需要的特征
data = pd.concat([pop, pop_change], axis=1)[    # 在列上做合并
    ['Population', 'Pupulation Changed/%']]

data.head()
| State | Population | Pupulation Changed/% |
|---|---|---|
| Alabama | 4903185.0 | 21.064652 |
| Alaska | 731545.0 | 32.217282 |
| Arizona | 7278717.0 | 97.571264 |
| Arkansas | 3017804.0 | 28.058301 |
| California | 39512223.0 | 31.885389 |
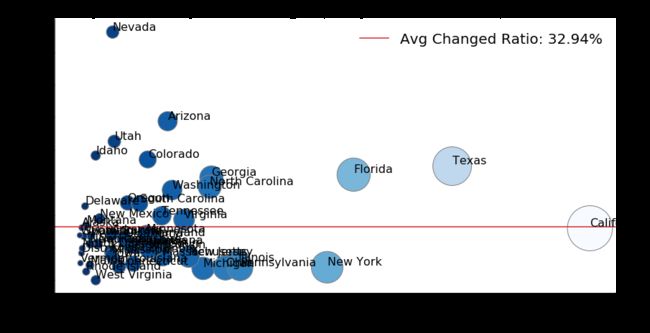
将人口总数与人口增长率数据分别映射到散点图 x、y 坐标及点颜色和大小。
plt.rcParams['figure.figsize'] = (14, 7)  #  # 图像显示大小(长, 宽)

x = data['Population']            # x变量
y = data['Pupulation Changed/%']  # y变量

plt.scatter(x, y,
            marker='o',                  # 点的形状
            s=data['Population']*0.0001, # 点的大小
            c=data['Population'],        # 点的颜色
            cmap=plt.cm.Blues_r,         # 调色板,与c配合使用
            edgecolors='gray')  # 散点图标记的轮廓及填充颜色

plt.xlabel('Population')
plt.ylabel('Pupulation Changed /%')
# 画均值线
plt.axhline(y=y.mean(),color='tab:red',label=f'Avg Changed Ratio:{y.mean():.2f}%')

plt.legend()   # 添加图例

s = data.index # 取出索引

for xpos, ypos, text in zip(x, y, s):    # 将坐标(x,y)和索引(州)打包然后遍历
    plt.text(xpos, ypos, text, size=16,va='bottom',ha='left')  # 设置文字说明

plt.title('Population & Pupulation Changed (Compared to Year 1990) of American') # 设置标题
- 全美各州在 1990 - 2019 年间的人口平均增长率为 32.94%;
- 在人口最大的四个州中,Califonia 人口增长率与平均水平相当,Texas 与 Florida 有了超平均数的增长,而 New York 不出意外地没有达到平均增长率;
- 在人口增速方面 Nevada 和 Arizona 两州有着最好的表现。
对于人口数量较少和人口增速不明显的多数州,其数据被压缩至平均线以下的 0 轴附近,可通过将数据进行对数变换(log)的方法,将数据均匀分布。
import numpy as np

plt.rcParams['figure.figsize'] = (14, 7)

x = np.log(data['Population'])            # 将数据进行对数变换(log)
y = np.log(data['Pupulation Changed/%'])  # 将数据进行对数变换(log)

plt.scatter(x, y,
            marker='o',
            s=data['Population']*0.0001,
            c=data['Population'],
            cmap=plt.cm.Blues,
            label='Changed of States of American',
            edgecolors='gray')  # 散点图标记的轮廓及填充颜色

plt.xlabel('log (Population)')
plt.ylabel('log (Pupulation Changed /%)')


s = data.index

for xpos, ypos, text in zip(x, y, s):
    plt.text(xpos, ypos, text, size=16, va='bottom', ha='left')

plt.title('Population & Pupulation Changed (Compared to Year 1990) of American')
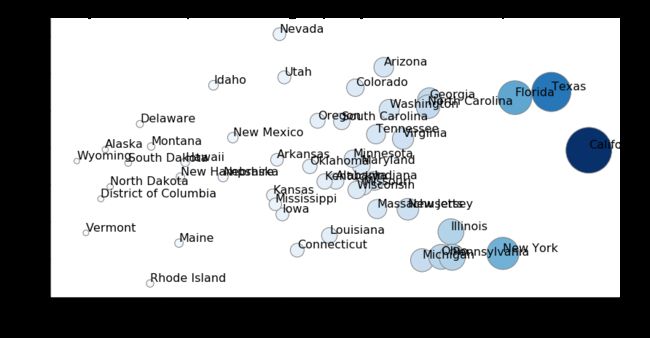 从输出结果可以看出,数据在对数坐标系下,分散变得十分均匀,各数据点被均匀拉开。
种族及人口变化率
白人
通过以下代码计算各州人口增长率与白人增长率,计算原理与总人口增长率计算原理相同。
# 在原表中指定列'Year'的1990和2019数据
data = df.loc[(df['Year'] == 1990) |(df['Year'] == 2019) ]

# 计算美国各州人口增长率
pop_change=data.pivot_table(index='State',columns='Year',values='Population',aggfunc='sum')# 数据透析表:列为年份,1990和2019两列
pop_change['Pupulation Changed/%']=100*(pop_change[2019]-pop_change[1990])/pop_change[1990]# 在原表新增一列人口变化率
pop_change

# 计算美国各州白人人口增长率
white_change=data.loc[data['Race']=='White'].pivot_table(index='State',columns='Year',values='Population',aggfunc='sum')
white_change['White Changed/%']=100*(white_change[2019]-white_change[1990])/white_change[1990]
white_change

# 将人口增长率与白人增长率数据合并
changed=pd.concat([pop_change,white_change],axis=1) # 将两个表按列合并,共6列

# 挑选主要字段
changed=changed[['Pupulation Changed/%','White Changed/%']]  # 取出'Pupulation Changed/%'和'White Changed/%'两列

# 展示前5行数据
changed.head()
| Year | Pupulation Changed/% | White Changed/% |
|---|---|---|
| State | ||
| Alabama | 21.064652 | 15.051925 |
| Alaska | 32.217282 | 18.947448 |
| Arizona | 97.571264 | 85.805934 |
| Arkansas | 28.058301 | 23.990308 |
| California | 31.885389 | 19.912456 |
将各州人口增长率与各州白人增长率分别映射到散点图,通过 np.ployfit 拟合其关系并绘制拟合曲线,同时绘制 y = x 曲线,该曲线表示,种族增长率与人口增长率一致。
plt.rcParams['figure.figsize'] = (10, 6)

x = changed['Pupulation Changed/%']
y = changed['White Changed/%']

# 绘制各州人口及白人增长数据
plt.scatter(x, y,
            marker='o',s=120,
            label='Changed of States of American',
            edgecolors='tab:red',facecolor='white') # 散点图标记的轮廓及填充颜色

plt.xlabel('Pupulation Changed /%')
plt.ylabel('White Race Changed /%')

# 拟合增长率曲线

f_1 = np.polyfit(x, y,deg=1)   # 对(x, y)得到拟合多项式系数f_1,自由度为1

# 绘制 白人人口增长率 拟合的增长曲线
plt.plot(x,np.polyval(f_1, x), # np.polyval(f_1,x)计算多项式的函数值。返回在x处多项式的值,p为多项式系数
         lw=2,color='tab:orange',label='Increase Ratio of White Race') # lw:线宽

# 绘制平衡增长曲线  y=x
plt.plot(np.linspace(0,150,20), # 等差数列:在0~150之间划分20个点;因为线性为“--”,所以这里只是规定了0~150的范围
         np.linspace(0,150,20),
         color='tab:blue',
         label='Increase Ratio of Balance',ls='--',lw=3)

plt.legend()    # 添加图例

# 添加文字说明
plt.text(25,75,'District of Columbia',fontsize=20,color='tab:red',ha='center',va='bottom')
plt.text(155,120,'Nevada',fontsize=20,color='tab:red',ha='center',va='bottom')

plt.title('Population & White Race Changed of States of American')
从输出结果可以看出:
- 种族增长率与人口增长率有很好的线性关系,与 y = x 平衡线对比,白人在各州的增长率斜率小于平衡线斜率(橘色线斜率 < 蓝色线),说明白人增速稍低于平衡增速;
- District of Columbia 州种族增长率显著高于平均水平,白人增速明显。
所有种族
用类似数据处理过程获得全部种族人口增长率与种族增长率数据。
data = df.loc[(df['Year'] == 1990) | (df['Year'] == 2019)]

# 计算美国各州人口增长率
changed = data.pivot_table(index='State', columns='Year', values='Population',aggfunc='sum')
changed['Pupulation Changed /%'] = 100 * \
    (changed[2019]-changed[1990])/changed[1990]


race_columns = ['Pupulation Changed /%']
for race in ['American Indian or Alaska Native', 'Asian or Pacific Islander', 'Black or African American', 'White']:

    # 计算美国各种族人口增长率
    race_change = data.loc[data['Race'] == race].pivot_table(
        index='State', columns='Year', values='Population',aggfunc='sum')   # 数据透析表:两列1990和2019
    race_change[race+' Changed /%'] = 100 * \          # 每次新增一列种族人口变化率
        (race_change[2019]-race_change[1990])/race_change[1990]

    # 将人口增长率与各族人口增长率数据合并
    changed = pd.concat([changed, race_change], axis=1)

    race_columns.append(race+' Changed /%')    # 加入各种族人口变化率标签
# race_change加入循环前是3列,每个循环都是3列,所以changed总共是15列
# 挑选主要字段
changed = changed[race_columns]  # 取出种族人口变化率标签的那五列

# 展示前5行数据
changed.head()
| Year | Pupulation Changed /% | American Indian or Alaska Native Changed /% | Asian or Pacific Islander Changed /% | Black or African American Changed /% | White Changed /% |
|---|---|---|---|---|---|
| State | |||||
| Alabama | 21.064652 | 135.798817 | 289.331931 | 31.059229 | 15.051925 |
| Alaska | 32.217282 | 47.064691 | 217.124410 | 58.636664 | 18.947448 |
| Arizona | 97.571264 | 91.725016 | 436.006760 | 270.124184 | 85.805934 |
| Arkansas | 28.058301 | 178.132082 | 442.256511 | 30.806671 | 23.990308 |
| California | 31.885389 | 167.208411 | 123.198473 | 22.854617 | 19.912456 |
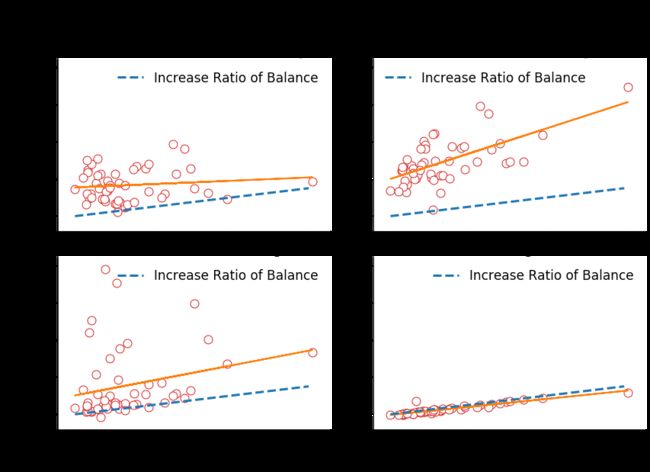
通过 plt.subplots 接口生成一张画布 fig 和 2 * 2 的子图对象,在每个子图对象分别绘制每个种族的增长率数据。
plt.rcParams['figure.figsize'] = (12, 8)

# 生成 2 * 2 的画布,并共享所有子图x,y轴范围
fig, axs = plt.subplots(2, 2, sharex=True, sharey=True)
# fig代表整个图像,ax代表坐标轴和画的子图,通过下标获取需要的子区域。

axs = axs.ravel()  # 将 2 * 2 的子图对象展平成 1 * 4的子图对象,下面好遍历所有子图

x = changed['Pupulation Changed /%']  # x均为总人口变化率

for i, race in enumerate(race_columns[1:]): # 取出四个种族的人口变化率(除了总人口变化率之外)

    ax = axs[i]        # 遍历每个子图
    y = changed[race]  # y为对应种族的人口变化率

    # 绘制各州人口及白人增长数据
    ax.scatter(x, y,
               marker='o', s=120,     # 散点的形状和大小
               edgecolors='tab:red', facecolor='white')  # 散点图标记的轮廓及填充颜色
    # 拟合增长率曲线
    f_1 = np.polyfit(x, y, deg=1)  # 对(x, y)得到拟合多项式系数f_1,自由度为1(即多项式次数为1)

    # 绘制拟合的增长曲线
    ax.plot(x, np.polyval(f_1, x), # 计算多项式的函数值。返回在x处多项式的值,f_1为多项式系数,元素按多项式降幂排序
            lw=2, color='tab:orange')

    # 绘制平衡增长曲线  y=x
    ax.plot(np.linspace(0, 150, 20),
            np.linspace(0, 150, 20),
            color='tab:blue',
            label='Increase Ratio of Balance', ls='--', lw=3)

    ax.legend(fontsize=17)
    ax.set_title(race,fontsize=17)

    # 第一列和最后一行分别显示y坐标轴标题和x坐标轴标题
    if i in [2, 3]:
        ax.set_xlabel('Pupulation Changed /%')  # 在画第三和第四个图的时候标注x轴标题
    if i in [0, 2]:
        ax.set_ylabel('Race Changed /%')        # 在画第一和第三个图的时候标注y轴标题

# 添加画布标题
fig.suptitle('Population & Race Changed of States of American\n',
             size=25, va='bottom')

# 调整子图间距为紧凑
plt.tight_layout()
从输出结果可以看出:
- American Indian or Alaska Native 本土原著名的种族增长率正逐步放缓,其斜率小于平均线;
- Asian or Pacific Islander 亚裔种族增长率为四个种族中最高;
- Black or African American 黑人虽然在增长率上不及亚裔,但在个别州有较为显著增长(图形上表现出大量的偏离拟合曲线点);
- White 占据人口主要数量的白人与全美总人口增长率大致相当。
通过以下过程,将所有种族人口增长率数据进行纵向拼接。
data = df.loc[(df['Year'] == 1990) |(df['Year'] == 2019) ]

# 计算美国各州人口增长率
changed=data.pivot_table(index='State',columns='Year',values='Population',aggfunc='sum')
changed['Pupulation Changed /%']=100*(changed[2019]-changed[1990])/changed[1990]

race_changes=pd.DataFrame() # 创建二维数组

for race in ['American Indian or Alaska Native', 'Asian or Pacific Islander', 'Black or African American','White']:

    # 计算美国各州各种族人口增长率
    race_change=data.loc[data['Race']==race].pivot_table(index='State',columns='Year',values='Population',aggfunc='sum')
    race_change['Race Changed /%']=100*(race_change[2019]-race_change[1990])/race_change[1990]  # 新增一行该种族的人口变化率
    race_change['Race']=race          # 新增一行该种族的名称

    # 将人口增长率与各种族人口增长率数据合并
    race_change=pd.concat([changed,race_change],axis=1)       # 按列拼接
    race_changes=pd.concat([race_changes,race_change],axis=0) # 按列拼接完再进行按行拼接

# 挑选主要字段
race_changes=race_changes[['Pupulation Changed /%','Race Changed /%','Race']]

# 展示前5行数据
race_changes.head()
| Year | Pupulation Changed /% | Race Changed /% | Race |
|---|---|---|---|
| State | |||
| Alabama | 21.064652 | 135.798817 | American Indian or Alaska Native |
| Alaska | 32.217282 | 47.064691 | American Indian or Alaska Native |
| Arizona | 97.571264 | 91.725016 | American Indian or Alaska Native |
| Arkansas | 28.058301 | 178.132082 | American Indian or Alaska Native |
| California | 31.885389 | 167.208411 | American Indian or Alaska Native |
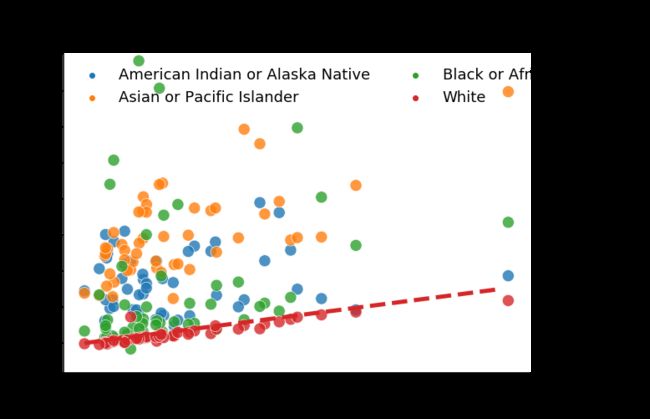
通过 seaborn 的 scatterplot 接口绘制所有种族的人口增长率与总人口增长率散点图,从输出结果可以看出,该图是将 2 * 2 的子图进行了合并展示,并通过颜色将各种族进行了区分。
import seaborn as sns
plt.rcParams['figure.figsize'] = (10, 7)

sns.scatterplot(
    x='Pupulation Changed /%',
    y='Race Changed /%',
    hue='Race', # 将种族列传入hue,不同种族会输出不同颜色
    s=200,
    alpha=0.8,
    data=race_changes,
)

plt.ylim(-80, 800)
ax = plt.gca()

# 获取图例对象及图例标签对象
h, l = ax.get_legend_handles_labels()
# 第0个图例对象是图例标题,此处将其删除,不显示
ax.legend(h[1:], l[1:], ncol=2, loc=2, fontsize=18)

# 绘制平衡增长曲线  y=x
plt.plot(np.linspace(0, 150, 20),
        np.linspace(0, 150, 20),
        color='tab:red',
        label='Increase Ratio of Balance', ls='--', lw=5)

plt.title('Population & Race Changed of States of American\n',
          size=25, va='bottom')
从输出结果可以看出:
- 白人增长率数据点与平衡线(红色)分布最为一致;
- 少数族裔相比白人有着较高的人口增长率。
黑人与亚裔
黑人和亚裔人口增长率有着较为亮眼地表现,以下数据处理过程获得了各州黑人及亚裔的不同增长率。
data = df.loc[(df['Year'] == 1990) | (df['Year'] == 2019)]

# 计算美国各州人口增长率
changed = pd.DataFrame()
race_columns = []
for race in ['Asian or Pacific Islander', 'Black or African American']:

    # 计算美国各州白人人口增长率
    race_change = data.loc[data['Race'] == race].pivot_table(
        index='State', columns='Year', values='Population',aggfunc='sum')
    race_change[race+' Changed /%'] = 100 * \
        (race_change[2019]-race_change[1990])/race_change[1990]

    # 将人口增长率与白人增长率数据合并
    changed = pd.concat([changed, race_change], axis=1)

    race_columns.append(race+' Changed /%')

# 挑选主要字段
changed = changed[race_columns]

# 展示前5行数据
changed.head()
| Year | Asian or Pacific Islander Changed /% | Black or African American Changed /% |
|---|---|---|
| State | ||
| Alabama | 289.331931 | 31.059229 |
| Alaska | 217.124410 | 58.636664 |
| Arizona | 436.006760 | 270.124184 |
| Arkansas | 442.256511 | 30.806671 |
| California | 123.198473 | 22.854617 |
将各州亚裔和黑人种族人口增长率分别映射到 x、y 将增长率 超 300% 的州用不同颜色进行标记。
plt.rcParams['figure.figsize'] = (15, 8)

x = changed['Asian or Pacific Islander Changed /%']
y = changed['Black or African American Changed /%']

plt.scatter(x, y,
            marker='o', s=120,
            label='Changed of States of American',
            edgecolors='tab:red', facecolor='white')  # 散点图标记的轮廓及填充颜色

plt.xlabel('Asian or Pacific Islander Changed /%')
plt.ylabel('Black or African American Changed /%')


for i in range(len(changed)):
    limit_changed = 300
    # 亚裔增长更快的州
    if (changed.iloc[i, 0] > limit_changed) & (changed.iloc[i, 1] < limit_changed):
        color = 'tab:blue'
    # 黑人增长更快的州
    elif (changed.iloc[i, 1] > limit_changed) & (changed.iloc[i, 0] < limit_changed):
        color = 'tab:red'
    # 亚裔和黑人增长均较快的州
    elif (changed.iloc[i, 1] > limit_changed) & (changed.iloc[i, 0] > limit_changed):
        color = 'tab:orange'
    else:
        color = 'black'

    plt.text(changed.iloc[i, 0], changed.iloc[i, 1], changed.index[i],
             fontsize=20, color=color, ha='center', va='bottom')


plt.title('Asian or Pacific Islander & Black or African American Race Changed of States of American')
从运行结果可以看出:
- 亚裔增长主要发生在以 Georgia 为代表的蓝色州;
- 黑人增长主要发生在以 Idaho 为代表的红色州;
- 亚裔和黑人在 North Dakota、South Dakota、Nevada 三个州均有较高的增长;
- 亚裔和黑人的增长,在一定程度下,带有一定的地区性特色。
人口结构
各年龄人数随年份变化
将数据集按年份和平均年龄进行聚合,并将年份、平均年龄、人口数映射到散点图。
plt.rcParams['figure.figsize'] = (18, 8)

data = df

# # 获取州、种族的聚合结果,并按升序排序
data = data.groupby(['Year','Mean Age'],as_index=False)['Population'].sum().sort_values(['Population'])

plt.scatter(
    x=data['Year'],
    y=data['Mean Age'],
    c=data['Population'],
    s=data['Population']*0.00003,
    ec='tab:gray',
    cmap=plt.cm.RdBu_r,
    alpha=0.8)

ax = plt.gca()

# 不显示左侧和底部纵坐标轴
ax.spines['left'].set_visible(False)
ax.spines['bottom'].set_visible(False)

# 显示 y 轴网格线
ax.grid(b=True,axis='y',lw=1)

plt.ylabel('Mean Age')

plt.title('Population Distribution of Age Group of American From Year 1990 to Year 2019')
从运行结果可以看出,美国人口结构正趋向于老龄化,表现在:
- 1990 年:人口结构按年龄组分布,呈现出 20 - 40 岁的单峰分布;
- 2019 年:原先的20 - 40 岁已转移至 40-70 岁年龄组,1990 年以来的新生儿逐渐转移至 20-40 年龄组,呈现出双峰分布。
各年龄组构成的人口结构
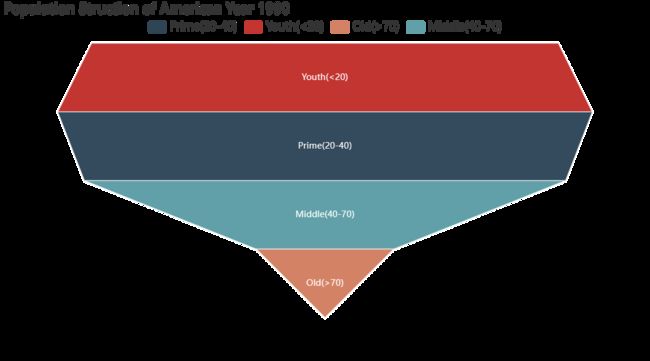
将平均年龄字段按照 20,40,70 三个节点进行切分,获得 青年、壮年、中年、老年 4 个年龄分组段,聚合各分组段人数后用漏斗图可视化 1990 年的人口结构。
!pip install pyecharts==1.7.1
from pyecharts import options as opts
from pyecharts.charts import Funnel

data = df.loc[df['Year'] == 1990]
# 将平均年龄进行数据切分,生成新的组
data['Age Group3'] = pd.cut(
    data['Mean Age'],
    bins=[0, 20, 40, 70, 100],
    labels=['Youth(<20)', 'Prime(20-40)', 'Middle(40-70)', 'Old(>70)'])
data = data.groupby(['Age Group3'], as_index=False)['Population'].sum()
data['Population'] = data['Population']/np.sum(data['Population'])*100

funel = Funnel()
funel.add(
    " ",
    [list(z) for z in zip(data['Age Group3'], data['Population'])],
    sort_='none',
    label_opts=opts.LabelOpts(position="inside"),
)
funel.set_global_opts(
    title_opts=opts.TitleOpts(
        title="Population Struction of American Year 1990",),
    legend_opts=opts.LegendOpts(
        pos_top='5%', textstyle_opts=opts.TextStyleOpts(font_size=15)),
)
funel.render_notebook()
从输出结果可以看出:1990 年的美国人口结构以 20-40 的壮年为主。
data = df.loc[df['Year'] == 2019]
data['Age Group3'] = pd.cut(
    data['Mean Age'],
    bins=[0, 20, 40, 70, 100],
    labels=['Youth(<20)', 'Prime(20-40)', 'Middle(40-70)', 'Old(>70)'])
data = data.groupby(['Age Group3'], as_index=False)['Population'].sum()
data['Population'] = data['Population']/np.sum(data['Population'])*100

funel = Funnel()
funel.add(
    " ",
    [list(z) for z in zip(data['Age Group3'], data['Population'])],
    sort_='none',
    label_opts=opts.LabelOpts(position="inside"),
)
funel.set_global_opts(
    title_opts=opts.TitleOpts(
        title="Population Struction of American Year 2019",),
    legend_opts=opts.LegendOpts(
        pos_top='5%', textstyle_opts=opts.TextStyleOpts(font_size=15)),
)
funel.render_notebook()
从运行结果可以看出,时过境迁,2019 年美国人口结构已悄然下移。
新生儿出生率
统计各州 <1 和 1-4 两个年龄组(Age Group)的年度人口增长率,分析各州新生儿出生率,数据处理过程详见代码注释。
data = df

# 选出平均年龄小于 3 的样本数据,即对应 <1 和 1-4 两个年龄组
data = data.loc[data['Mean Age'] < 3]

# 空 df 对象,装各州处理后数据
state_data = pd.DataFrame()

for state in list(set(data['State'])):
    # 聚合得到每个州总人数
    tmp = data.loc[data['State'] == state].groupby(
        ['Year'], as_index=False)['Population'].sum()

    # 将 Population 列移位 1 个周期,获得新的特征列 Population Last Year 即 去年总人口数
    tmp['Population Last Year'] = tmp.shift()['Population']

    # 新生儿出生率计算原理为  100*(当年人口数 - 去年人口数) / 去年人口数
    tmp['Birth Increase Ratio /%'] = 100 * (tmp['Population']-tmp['Population Last Year']) / tmp['Population Last Year']

    # 由于 1990 年没有上年数据,因此其增长率计算结果为空值,将其增长率填充为 0
    tmp['Birth Increase Ratio /%'].fillna(value=0, inplace=True)
    tmp['State'] = state

    # 将所有州的数据进行列方向上的合并
    state_data = pd.concat([state_data, tmp])

state_data = state_data.sort_values('Population')

# 查看前 5 行数据
state_data.head()
| Year | Population | Population Last Year | Birth Increase Ratio /% | State | |
|---|---|---|---|---|---|
| 29 | 2019 | 29043.0 | 29625.0 | -1.964557 | Vermont |
| 28 | 2018 | 29625.0 | 30004.0 | -1.263165 | Vermont |
| 27 | 2017 | 30004.0 | 30234.0 | -0.760733 | Vermont |
| 26 | 2016 | 30234.0 | 30539.0 | -0.998723 | Vermont |
| 25 | 2015 | 30539.0 | 30609.0 | -0.228691 | Vermont |
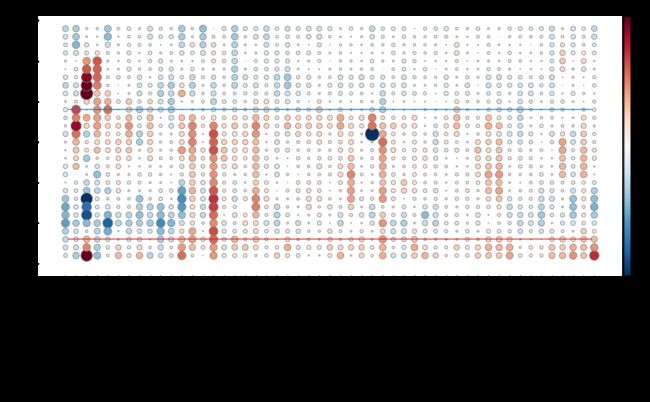
散点图颜色映射的数据,可通过 plt.colorbar 生成的颜色条做辅助可视化,方便读者阅读每个颜色点对应的绝对数值,其原理是将散点图返回的 mappable 对象传入 plt.colorbar 中,plt.colorbar 生成的颜色条(cbar),其颜色板和显色数据区域通过散点图接口中的 cmap、vmin、vmax等参数控制。
plt.rcParams['figure.figsize'] = (18, 8)

# 生成画布并新增子图,111 表示 1行1列第1个子图
ax = plt.figure().add_subplot(111)

# ax.scatter 接口返回的 mappable 对象,用以传入 plt.colorbar 接口中,实现颜色与数据在颜色条上的映射
mappable = ax.scatter(
    x=state_data['State'],
    y=state_data['Year'],
    c=state_data['Birth Increase Ratio /%'],
    s=np.abs(state_data['Birth Increase Ratio /%'])*50,  # 将增长率为负值的数据取绝对值
    ec='gray',
    vmin=-7,  # 颜色条映射数据最小值
    vmax=7,  # 颜色条映射数据最大值
    cmap=plt.cm.RdBu_r,
)


# 将 x 轴刻度标签旋转 90 度
ax.tick_params(axis='x', rotation=90)
ax.spines['left'].set_visible(False)
ax.spines['bottom'].set_visible(False)

# 添加 1993、2009 两条水平辅助线
ax.axhline([1993], xmin=0.05, xmax=0.95, color='tab:red')
ax.axhline([2009], xmin=0.05, xmax=0.95, color='tab:blue')

# 添加颜色条
cbar=plt.colorbar(
    mappable=mappable,
    ax=ax,
    aspect=40,  # 颜色条的长宽比例  =长度/宽度
    pad=0.005,  # 散点图和颜色条的间距
    fraction=0.02  # 散点图和颜色条在画布上宽度的比例  =颜色条宽度/散点图宽度
)

ax.set_title(
    'Birth Increase Ratio of States of American from Year 1990 to 2019')
从输出结果可以看出:
- 人口基数最大的 California, 1993 年以后新生儿出生率一直处于下降阶段;
- 大多数州在 2009 年以后均呈现出新生儿出生率下降状况;
- North Dakota 和 District of Columbia 两州阶段性地出现婴儿潮。
性别分布
选择 1990 、2010、 2019 三个年份,将数据集按照性别(Gender)、种族(Race)进行人口数(Population)聚合并按升序排列。聚合后,将聚合数据集中的 Gender、Race 特征分别映射至散点图 x、y 坐标,将 Population 人口数特征映射至点大小(s),将 Gender 映射至点颜色(c)。
fig, axs = plt.subplots(1, 3, figsize=(15, 6), sharey=True, sharex=True)

for i, year in enumerate([1990, 2010, 2019]):
    ax = axs[i]
    data = df.loc[df['Year'] == year].groupby(
        ['Gender', 'Race'], as_index=False)['Population'].sum().sort_values('Population')
    data

    ax.scatter(
        x=data['Gender'],
        y=data['Race'],
        c=data['Gender'].apply(lambda x: 'tab:red' if x ==
                               'Female' else 'tab:blue'),
        s=data['Population']*0.00007,
        ec='gray',
    )

    ax.set_ylim(-0.5, 4)
    ax.set_xlim(-1, 1.5)
    ax.set_title('Year %d' % year)

    if i > 0:
        ax.spines['left'].set_visible(False)

fig.suptitle('Population Distribution Varies with Gender of USA',
             size=25, va='bottom')
从输出结果可以看出,各种族在选定的3个年份并未呈现出显著差异,说明美国的人口结构中,性别分布相对均匀。
实验总结
本实验以散点图为主要绘图对象,对美国 1990 - 2019 年期间人口与种族变迁做了研究,通过分析和可视化,得出以下结论:
- 美国是以白人为主体种族的国家,在各大州白人的数量和占比都具有绝对优势;
- 在过去的 29 年间,白人一直保持着与美国国家人口增速相同的增长速率;
- 黑人和亚裔作为仅次于白人排名的种族,在过去 29 年间有了较高的增速,且主要人口增速表现出一定的地域性;
- 美国在人口结构上,正逐渐趋向于老龄化,与此同时,新生儿出生率自 2009 年以后有了较为明显的下降;
- 各种族在统计期内性别比例未出现较明显的失衡。
本次实验中,我们学会了:
- 散点图接口及其参数的使用。
- 漏斗图的绘制。
- 画布上多子图的绘制。
- 散点图的数据拟合。
- 颜色条的绘制和应用。
- 数据对数变换技巧。
