GEE7:逐月NDVI最大值合成(获取CSV数据)
逐月NDVI最大值合成
-
-
- MOD13Q1逐月NDVI最大值合成
-
MOD13Q1逐月NDVI最大值合成
var roi=table.geometry();
// 调用MODIS的NDVI数据集250m
var dataset = ee.ImageCollection('MODIS/061/MOD13Q1')
                  // 筛选研究时间和覆盖研究区域的影像
                  .filter(ee.Filter.date('2005-01-01', '2013-01-01'))
                  .select('NDVI')
                  // 对NDVI波段进行0.0001比例缩放,计算kndvi
                  .map(function(image){
                    return image.multiply(0.0001).pow(2).tanh().set('system:time_start',image.get('system:time_start'))
                                .clip(table)
                  });

var kndviVis = {
   min: -0.2,
   max: 1.0,
  palette: [
    'FFFFFF', 'CE7E45', 'DF923D', 'F1B555', 'FCD163', '99B718', '74A901',
    '66A000', '529400', '3E8601', '207401', '056201', '004C00', '023B01',
    '012E01', '011D01', '011301'
  ],
};
Map.centerObject(table, 10);
Map.addLayer(dataset, kndviVis, 'kNDVI');

// 2020年kNDVI成每月最大值合成
var years = ee.List.sequence(2005, 2013);
var months = ee.List.sequence(1, 12);
var monthly_max =  ee.ImageCollection.fromImages(
  years.map(function (y) {
    return months.map(function(m) {
    return dataset.filter(ee.Filter.calendarRange(y,y, 'year')).filter(ee.Filter.calendarRange(m, m, 'month')).max().set('year', y).set('month', m).set('system:time_start', ee.Date.fromYMD(y, m, 1));
    });
  }).flatten()
);
Map.addLayer(monthly_max.mean().clip(table), kndviVis, 'yearly_mean');
print('2005-2013年月最大值时间序列',ui.Chart.image.series(monthly_max, table, ee.Reducer.mean(), 10000));

// 输出每月合成的NDVI最大值
monthly_max.aggregate_array('month')
           .evaluate(function (months) {
                  months.forEach(function (month) {
                       var image = monthly_max
                           .filterMetadata('month', 'equals', month)
                           .first()
                       var description = 'NDVI_max-'+ '2020_' + month
            Export.image.toDrive({
              image: image,
              description: description,
              folder:"2005-2013_monthly_max",
              scale: 250,
              crs: "EPSG:4326",
              region: table,
              maxPixels: 1e13,
            });
    })
})

//将2005-2013全年月最大值的平均值结果导出
Export.image.toDrive({
  image: monthly_max.mean(),
  description: '2020_yearly_mean',
  folder: 'AVHRR_NDVI',
  crs: 'EPSG:4326',
  fileFormat:'GeoTIFF',
  region: table,
  scale: 250,
  maxPixels: 1e13,
})
注意分辨率的问题,ee.reducer()
2005-2013年月最大值时间序列 :

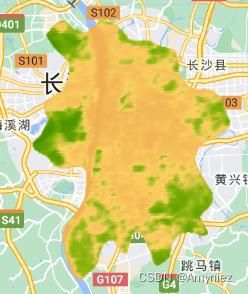
长沙市2005-2013年平均最大NDVI影像:
CSV数据导出:
