pandas 数据清洗教程_使用Pandas进行数据操作:简要教程
pandas 数据清洗教程
Learn three data manipulation techniques with Pandas in this guest post by Harish Garg, a software developer and data analyst, and the author of Mastering Exploratory Analysis with pandas.
在软件开发人员和数据分析师,《 熊猫探索精通分析 》一书的作者Harish Garg的这篇客座帖子中,学习了有关Pandas的三种数据处理技术。
使用inplace参数修改Pandas DataFrame (Modifying a Pandas DataFrame Using the inplace Parameter)
In this section, you’ll learn how to modify a DataFrame using the inplace parameter. You’ll first read a real dataset into Pandas. You’ll then see how the inplace parameter impacts a method execution’s end result. You’ll also execute methods with and without the inplace parameter to demonstrate the effect of inplace.
在本节中,您将学习如何使用inplace参数修改DataFrame。 您首先需要将一个真实的数据集读入Pandas。 然后,您将看到inplace参数如何影响方法执行的最终结果。 您还将执行带有和不带有inplace参数的方法,以演示inplace的效果。
Start by importing the Pandas module into your Jupyter notebook, as follows:
首先将Pandas模块导入Jupyter笔记本中 ,如下所示:
import pandas as pd
Then read your dataset:
然后读取您的数据集:
top_movies = pd.read_csv('data-movies-top-grossing.csv', sep=',')
- See the Pandas DataFrame Tutorial to learn more about reading CSV files.
- 请参阅《 Pandas DataFrame教程》以了解有关读取CSV文件的更多信息。
Since it’s a CSV file, you’ll have to use Pandas’ read_csv function for this. Now that you have read your dataset into a DataFrame, it’s time to take a look at a few of the records:
由于它是CSV文件,因此您必须使用Pandas的read_csv函数。 现在,您已经将数据集读入了DataFrame中,现在该看看一些记录了:
top_movies
The data you’re using is from Wikipedia; it’s the cross annex data for top movies worldwide to date. Most Pandas DataFrame methods return a new DataFrame. However, you may want to use a method to modify the original DataFrame itself.
您正在使用的数据来自Wikipedia; 这是迄今为止全球顶级电影的交叉附件数据。 大多数Pandas DataFrame方法返回一个新的DataFrame。 但是,您可能想使用一种方法来修改原始DataFrame本身。
This is where the inplace parameter is useful. Try calling a method on a DataFrame without the inplace parameter to see how it works in the code:
这是inplace参数有用的地方。 尝试在不带inplace参数的DataFrame上调用方法,以查看其在代码中的工作方式:
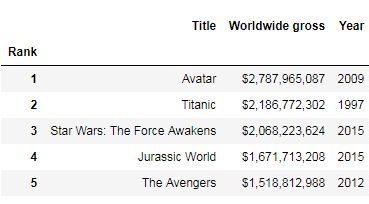
top_movies.set_index('Rank').head()
Here, you’re setting one of the columns as the index for your DataFrame. You can see that the index has been set in the memory. Now check to see if it has modified the original DataFrame or not:
在这里,您将其中一列设置为DataFrame的索引。 您会看到索引已在内存中设置。 现在检查是否修改了原始DataFrame:
top_movies.head()
As you can see, there’s no change in the original DataFrame. The set_index method only created the change in a completely new DataFrame in memory, which you could have saved in a new DataFrame. Now see how it works when you pass the inplace parameter:
如您所见,原始DataFrame没有任何变化。 set_index方法仅在内存中全新的DataFrame中创建了更改,您可以将其保存在新的DataFrame中。 现在看看传递inplace参数时它是如何工作的:
top_movies.set_index('Rank', inplace=True)
Pass inplace=True to the method and check the original DataFrame:
将inplace = True传递给该方法并检查原始DataFrame:
top_movies.head()
As you can see, passing inplace=True did modify the original DataFrame. Not all methods require the use of the inplace parameter to modify the original DataFrame. For example, the rename(columns) method modifies the original DataFrame without the inplace parameter:
如您所见,传递inplace = True确实修改了原始DataFrame。 并非所有方法都需要使用inplace参数来修改原始DataFrame。 例如,rename(columns)方法修改了不带inplace参数的原始DataFrame:
top_movies.rename(columns = {'Year': 'Release Year'}).head()
It’s a good idea to get familiar with the methods that need inplace and the ones that don’t.
熟悉需要就地使用的方法和不需要就地使用的方法是一个好主意。
分组方式 (The groupby Method)
In this section, you’ll learn about using the groupby method to split and aggregate data into groups. You’ll see how the groupby method works by breaking it into parts. The groupby method will be demonstrated in this section with statistical and other methods. You’ll also learn how to do interesting things with the groupby method’s ability to iterate over the group data.
在本节中,您将学习使用groupby方法将数据拆分和聚合为组。 您将通过分成几部分来了解groupby方法的工作方式。 groupby方法将在本节中用统计方法和其他方法进行演示。 您还将学习如何使用groupby方法迭代组数据来做有趣的事情。
Start by importing the pandas module into your Jupyter notebook, as you did in the previous section:
首先,将熊猫模块导入到Jupyter笔记本中,如上一节所述:
import pandas as pd
Then read your CSV dataset:
然后读取您的CSV数据集:
data = pd.read_table('data-zillow.csv', sep=',')
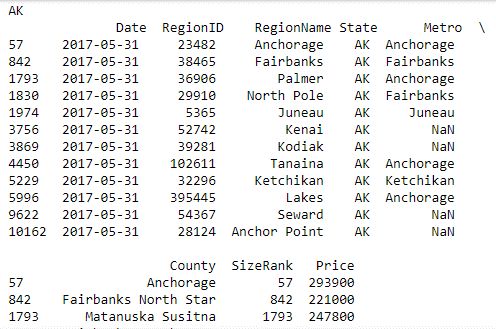
data.head()
Start by asking a question, and see if Pandas’ groupby method can help you get the answer. You want to get the mean Price value of every State:
首先提出一个问题,然后看看Pandas的groupby方法是否可以帮助您获得答案。 您想要获得每个州的平ASP格值:
grouped_data = data[['State', 'Price']].groupby('State').mean()
grouped_data.head()
Here, you used the groupby method for aggregating the data by states, and got the mean Price per State. In the background, the groupby method split the data into groups; you then applied the function on the split data, and the result was put together and displayed.
在这里,您使用groupby方法按州汇总数据,并获得了每个州的平ASP格。 在后台,groupby方法将数据分为几组; 然后将功能应用于拆分数据,结果汇总在一起并显示出来。
Time to break this code into individual pieces to see what happens under the rug. First, splitting into groups is done as follows:
是时候将该代码分解为单独的部分,看看在地毯下会发生什么。 首先,按以下步骤进行分组:
grouped_data = data[['State', 'Price']].groupby('State')
You selected a subset of data that has only State and Price columns. You then called the groupby method on this data, and passed it in the State column, as that is the column you want the data to be grouped by. Then, you stored the data in an object. Print out this data using the list method:
您选择了只有“状态”和“价格”列的数据子集。 然后,您对该数据调用groupby方法,并将其传递给State列,因为这是您希望对数据进行分组的列。 然后,您将数据存储在一个对象中。 使用列表方法打印出此数据:
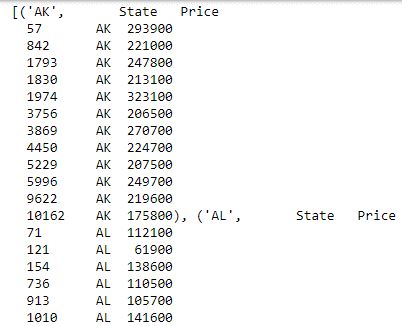
list(grouped_data)
Now, you have the data groups based on date. Next, apply a function on the displayed data, and display the combined result:
现在,您有了基于日期的数据组。 接下来,对显示的数据应用一个函数,并显示合并的结果:
grouped_data.mean().head()
You used the mean method to get the mean of the prices. After the data is split into groups, you can use Pandas methods to get some interesting information on these groups. For example, here, you get descriptive statistical information on each state separately:
您使用了均值法来获取价格均值。 将数据分为几组后,您可以使用Pandas方法获取有关这些组的一些有趣信息。 例如,在这里,您分别获得有关每个州的描述性统计信息:
grouped_data.describe()
You can also use groupby on multiple columns. For example, here, you’re grouping by the State and RegionName columns, as follows:
您还可以在多个列上使用groupby。 例如,在这里,您按州和地区名称列进行分组,如下所示:
grouped_data = data[['State',
                     'RegionName',
                     'Price']].groupby(['State', 'RegionName']).mean()
You can also get the number of records per State through the groupby and size methods, as follows:
您还可以通过groupby和size方法获取每个州的记录数,如下所示:
grouped_data = data.groupby(['State']).size()
In all the code demonstrated in this section so far, the data has been grouped by rows. However, you can also group by columns. In the following example, this is done by passing the axis parameter set to 1:
到目前为止,在本节中演示的所有代码中,数据都是按行分组的。 但是,您也可以按列分组。 在以下示例中,这是通过将axis参数设置为1来完成的:
grouped_data = data.groupby(data.dtypes, axis=1)
list(grouped_data)
You can also iterate over the split groups, and do interesting things with them, as follows:
您还可以遍历拆分组,并对其进行有趣的操作,如下所示:
for state, grouped_data in data.groupby('State'):
    print(state, 'n', grouped_data)
 Here, you iterate over the group data by State and publish the result with State as the heading, followed by a table of all the records from that State.
在这里,您可以按州对组数据进行迭代,并以州为标题发布结果,然后是该州所有记录的表格。
- Learn more by reading the post Descriptive statistics using Python.
- 通过阅读使用Python描述性统计信息了解更多信息 。
处理熊猫中的缺失值 (Handling Missing Values in Pandas)
In this section, you’ll see how to use various pandas techniques to handle the missing data in your datasets. You’ll learn how to find out how much data is missing, and from which columns. You’ll see how to drop the rows or columns where a lot of records are missing data. You’ll also learn how, instead of dropping data, you can fill in the missing records with zeros or the mean of the remaining values.
在本节中,您将看到如何使用各种熊猫技术来处理数据集中的缺失数据。 您将学习如何找出丢失的数据量以及从哪些列中查找数据。 您将看到如何删除很多记录缺少数据的行或列。 您还将学习如何用零或剩余值的平均值填充丢失的记录,而不是丢弃数据。
Start by importing the pandas module into your Jupyter notebook:
首先将pandas模块导入Jupyter笔记本:
import pandas as pd
Then read in your CSV dataset:
然后读取您的CSV数据集:
data = pd.read_csv('data-titanic.csv')
data.head()
该数据集是泰坦尼克号的乘客生存数据集,可从https://www.kaggle.com/c/titanic/data从Kaggle下载。
Now take a look at how many records are missing first. To do this, you first need to find out the total number of records in the dataset. You can do this by calling the shape property on the DataFrame:
现在看看首先丢失了多少条记录。 为此,您首先需要找出数据集中的记录总数。 您可以通过在DataFrame上调用shape属性来做到这一点:
data.shape
您可以看到记录的总数为891,列的总数为12。
Then it’s time to find out the number of records in each column. You can do this by calling the count method on the DataFrame:
然后是时候找出每列中的记录数了。 您可以通过在DataFrame上调用count方法来做到这一点:
data.count()
 The difference between the total records and the count per column represents the number of records missing from that column. Out of the 12 columns, you have 3 columns where values are missing. For example, Age has only 714 values out of a total of 891 rows; Cabin has values for only 204 records; and Embarked has values for 889 records.
总记录与每列计数之间的差表示该列中缺少的记录数。 在12列中,有3列缺少值。 例如,年龄在总共891行中只有714个值; 客舱仅具有204条记录的值; 并且Embarked具有889条记录的值。
There are different ways of handling these missing values. One of the ways is to drop any row where a value is missing, even from a single column, as follows:
有多种处理这些缺失值的方法。 一种方法是删除缺少值的任何行,即使是单列也是如此,如下所示:
data_missing_dropped = data.dropna()
data_missing_dropped.shape
When you run this method, you assign the results back into a new DataFrame. This leaves you with just 183 records out of a total of 891. However, this may lead to losing a lot of the data, and may not be acceptable.
运行此方法时,将结果分配回新的DataFrame中。 这样一来,在891条记录中,只有183条记录。但是,这可能会导致丢失大量数据,并且可能无法接受。
Another method is to drop only those rows where all the values are missing. Here’s an example:
另一种方法是只删除那些缺少所有值的行。 这是一个例子:
data_all_missing_dropped = data.dropna(how="all")
data_all_missing_dropped.shape
You do this by setting the how parameter for the dropna method to all.
您可以通过将dropna方法的how参数设置为all来做到这一点。
Instead of dropping rows, another method is to fill in the missing values with some data. You can fill in the missing values with 0, for example, as in the following screenshot:
代替删除行,另一种方法是用一些数据填充缺少的值。 例如,您可以使用0填写缺失值,如以下屏幕截图所示:
data_filled_zeros = data.fillna(0)
data_filled_zeros.count()
 Here, you’ve used the fillna method and passed the numeric value of 0 to the column you want to fill the data in. You can see that you have now filled all the missing values with 0, which is why the count for all the columns has gone up to the total number of count of records in the dataset.
在这里,您已经使用fillna方法并将数字0传递到要填充数据的列。您可以看到,现在所有缺失值都用0填充了,这就是为什么所有列已增加到数据集中记录总数。
Also, instead of filling in missing values with 0, you could fill them with the mean of the remaining existing values. To do so, call the fillna method on the column where you want to fill the values in and pass the mean of the column as the parameter:
另外,您可以用剩余的现有值的平均值来填充缺失值,而不用0来填充缺失值。 为此,请在要填充值的列上调用fillna方法,并将该列的平均值作为参数传递:
data_filled_in_mean = data.copy()
data_filled_in_mean.Age.fillna(data.Age.mean(), inplace=True)
data_filled_in_mean.count()
例如,在这里,您用现有值的平均值填写了Age的缺失值。
If you found this article interesting and want to learn more about data analysis, you can explore Mastering Exploratory Analysis with pandas, an end-to-end guide to exploratory analysis for budding data scientists. Filled with several hands-on examples, the book is the ideal resource for data scientists as well as Python developers looking to step into the world of exploratory analysis.
如果您发现本文有趣,并且想了解有关数据分析的更多信息,则可以探索使用pandas掌握掌握探索性分析 ,这是萌芽的数据科学家探索性分析的端到端指南。 本书提供了一些动手的示例,是希望踏入探索性分析世界的数据科学家和Python开发人员的理想资源。
翻译自: https://www.pybloggers.com/2018/11/data-manipulation-with-pandas-a-brief-tutorial/
pandas 数据清洗教程


