吴恩达机器学习作业笔记(Logistic 回归)
数据一共有三列,前两列是学生成绩,最后一列用1.0代表学生是否被录取
使用分类的方法进行学习,得到一个学生被录取的概率值。
零基础知识
pandas读取文件
import pandas as pd
data = pd.read_csv('path',sep = ',', header = 0, names = ['第一列','第二列','第三列'], encoding = 'utf-8')

原文链接:https://blog.csdn.net/O_nice/article/details/119667178
path:要读取的文件绝对路径 sep:指定列与列间的分隔符,默认sep = ‘,’ 若sep = ‘\t’,即列与列间用制表符\t分隔;若sep = ‘,’,即列与列间用逗号,分隔;
header:用作列名的行号,默认为0 若header = None,则表明数据中没有列名行;若header = 0,则表明第一行为列名;
names:列名命名或重命名
encoding:指定用于unicode文本编码格式,若encoding =‘utf-8’,则表明用UTF-8编码的文本;若encoding = ‘gbk’,则表明用gbk编码的文本;
dataframe格式使用标签提取数据
dataframe根据某列元素筛选数据
Pandas系列_DataFrame数据筛选
positive = data[data['admission'] == 1]  # 筛选出y=1的部分
negative = data[data.admission == 0] # 这两种写法是一样的
numpy矩阵按行合并
numpy 进行数组的拼接,分别在行和列上合并
np.c_[array1,array2] c_表示colum列 np.r_[array1,array2] r_表示row行
矩阵的点乘与叉乘
import numpy as np
a=np.array([[1,2,3],[1,2,3],[1,2,3]])
b=np.array([[1,2,3],[1,2,3],[1,2,3]])
print(a*b)
print(np.multiply(a,b))

[[1 4 9]
 [1 4 9]
 [1 4 9]]
[[1 4 9]
 [1 4 9]
 [1 4 9]]

 import numpy as np
a=np.array([[1,2,3],[1,2,3],[1,2,3]])
b=np.array([[1,2,3],[1,2,3],[1,2,3]])
print(np.dot(a,b))

[[ 6 12 18]
 [ 6 12 18]
 [ 6 12 18]]
sklearn进行数据评估
sklearn.metrics.classification_report(y_true, y_pred, labels=None, target_names=None, sample_weight=None, digits=2, output_dict=False)
classification_report&精确度/召回率/F1值
classification_report()函数介绍
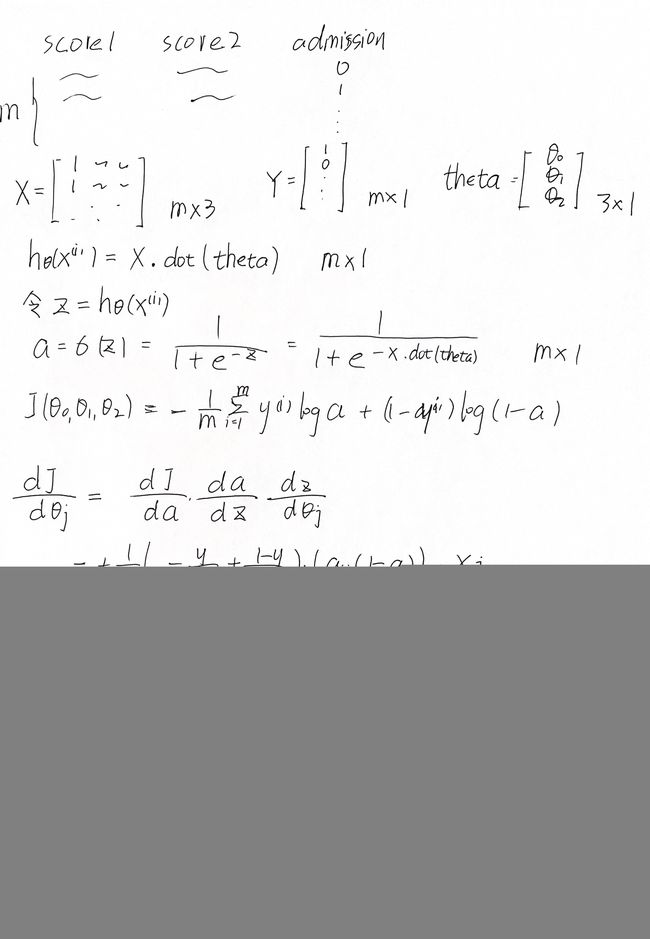
计算梯度时用到的方程
代码
import pandas as pd
import numpy as np
import matplotlib.pyplot as plt
import scipy.optimize as opt
from sklearn.metrics import classification_report

data = pd.read_csv('ex2data1.txt', sep=',', names=['score1', 'score2', 'admission'])
#print(data.head())
#(m, n) = data.shape
X = np.array(data[['score1', 'score2']]).reshape(-1,2)
X = np.c_[np.ones(len(X)),X]
y = np.array(data['admission'],dtype=float).reshape(-1,1)
theta = np.zeros(X.shape[1]).reshape(-1, 1)

def norm(X):
    mean = np.mean(X[:, 1:], axis=0)
    std = np.std(X[:, 1:], axis=0, ddof=1)
    X[:, 1:] = (X[:, 1:] - mean) / std
    return mean,std,X
mean,std,X = norm(X)
'''sigmoid函数'''
def sigmoid(x):
    return 1/(1+np.exp(-x))
'''定义Cost函数,这里也可以使用np.sum,/len(X)'''
def J(theta,X, y):
    return np.mean((-y) * np.log(sigmoid(X.dot(theta))) - (1 - y) * np.log(1 - sigmoid(X.dot(theta))))
'''定义梯度'''
def dJ(theta,X, y):
    return X.T.dot(sigmoid(X.dot(theta)) - y) / len(X)
'''定义传统的梯度下降'''
def grad_descend(X,y,theta_init,learning_rate,iters,error,listJ):
    i=0
    theta = theta_init
    while i < iters:
        grad = dJ(theta,X, y)
        temp=J(theta,X, y)
        listJ.append(temp)#将cost的值存到listJ中
        theta_old = theta
        theta = theta - learning_rate * grad
        if (abs(J(theta,X,y) - J(theta_old, X,y))) < error:
            print("第{}次梯度下降,达到理想误差".format(i+1))
            break
        i+=1
    return theta
'''执行梯度下降,并检查收敛性'''
listJ = []
#plt.plot(listJ)
theta = grad_descend(X,y,theta,0.01,1e5,1e-8,listJ)
print(theta)
'''数据可视化,打印决策边界'''
def visualData(data):
    positive = data[data['admission'] == 1]  # 筛选出y=1的部分
    negative = data[data.admission == 0] # 这两种写法是一样的
    plt.scatter(positive.score1, positive.score2, c='g', marker='o', label='Admitted')
    plt.scatter(negative.score1, negative.score2, c='r', marker='o', label='Not Admitted')
    plt.legend(loc=1)
    plt.xlabel('Exam1 Score')
    plt.ylabel('Exam2 Score')
x1 = np.arange(20,101,0.1).reshape(-1,1)
x2 = mean[1] - std[1] * (theta[0] + theta[1] * (x1 - mean[0]) / std[0]) / theta[2]
plt.plot(x1, x2, c='r', label="decision boundary")
visualData(data)
plt.show()
'''不用手写的梯度下降而采用优化算法利用优化算法,失败'''
#theta = np.zeros(X.shape[1])
#dJ = dJ(theta,X, y).reshape(-1,1)
#res = opt.minimize(fun=J, x0=theta, args=(X, y), method='Newton-CG', jac=dJ)
#res = opt.fmin_tnc(func=J, x0=theta, fprime=dJ, args=(X, y))
#print(res)
'''进行0.1分类,并进行sklearn评估'''
def predict(theta, X):
    return [1 if i > 0.6 else 0 for i in sigmoid(X.dot(theta))]
print(classification_report(y, predict(theta, X)))
