How do I Find Out Linux CPU Utilization?
From:http://www.cyberciti.biz/tips/how-do-i-find-out-linux-cpu-utilization.html
Whenever a Linux system CPU is occupied by a process, it is unavailable for processing other requests. Rest of pending requests must wait till CPU is free. This becomes a bottleneck in the system. Following command will help you to identify CPU utilization, so that you can troubleshoot CPU related performance problems.
Finding CPU utilization is one of the important tasks. Linux comes with various utilities to report CPU utilization. With these commands, you will be able to find out:
* CPU utilization
* Display the utilization of each CPU individually (SMP cpu)
* Find out your system's average CPU utilization since the last reboot etc
* Determine which process is eating the CPU(s)
Old good top command to find out Linux cpu load
The top program provides a dynamic real-time view of a running system. It can display system summary information as well as a list of tasks currently being managed by the Linux kernel.
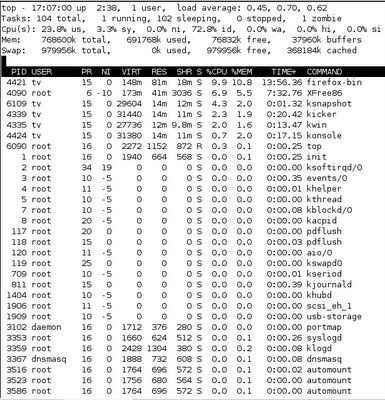
The top command monitors CPU utilization, process statistics, and memory utilization. The top section contains information related to overall system status - uptime, load average, process counts, CPU status, and utilization statistics for both memory and swap space.
Top command to find out Linux cpu usage
Type the top command:
$ top
You can see Linux CPU utilization under CPU stats. The task’s share of the elapsed CPU time since the last screen update, expressed as a percentage of total CPU time. In a true SMP environment (multiple CPUS), top will operate in number of CPUs. Please note that you need to type q key to exit the top command display.
The top command produces a frequently-updated list of processes. By default, the processes are ordered by percentage of CPU usage, with only the "top" CPU consumers shown. The top command shows how much processing power and memory are being used, as well as other information about the running processes.
Find Linux CPU utilization using mpstat and other tools
Please note that you need to install special package called sysstat to take advantage of following commands. This package includes system performance tools for Linux (Red Hat Linux / RHEL includes these tools by default).
# apt-get install sysstat
Use up2date command if you are using RHEL:
# up2date sysstat
Display the utilization of each CPU individually using mpstat
If you are using SMP (Multiple CPU) system, use mpstat command to display the utilization of each CPU individually. It report processors related statistics. For example, type command:
# mpstat Output:
Linux 2.6.15.4 (debian)         Thursday 06 April 2006

05:13:05  IST  CPU   %user   %nice    %sys %iowait    %irq   %soft  %steal   %idle    intr/s

05:13:05  IST  all   16.52    0.00    2.87    1.09    0.07    0.02    0.00   79.42    830.06
The mpstat command display activities for each available processor, processor 0 being the first one. Global average activities among all processors are also reported. The mpstat command can be used both on SMP and UP machines, but in the latter, only global average activities will be printed.:
# mpstat -P ALL
Output:
Linux 2.6.15.4 (wwwportal1.xxxx.co.in)         Thursday 06 April 2006

05:14:58  IST  CPU   %user   %nice    %sys %iowait    %irq   %soft  %steal   %idle    intr/s

05:14:58  IST  all   16.46    0.00    2.88    1.08    0.07    0.02    0.00   79.48    835.96

05:14:58  IST    0   16.46    0.00    2.88    1.08    0.07    0.02    0.00   79.48    835.96

05:14:58  IST    1   15.77    2.70    3.17    2.01    0.05    0.03    0.00   81.44    822.54
Another output from my HP Dual Opteron 64 bit server:# mpstat -P ALLOutput:
Linux 2.6.5-7.252-smp (ora9.xxx.in)   04/07/06

07:44:18     CPU   %user   %nice %system %iowait    %irq   %soft   %idle    intr/s

07:44:18     all    3.01   57.31    0.36    0.13    0.01    0.00   39.19   1063.46

07:44:18       0    5.87   69.47    0.44    0.05    0.01    0.01   24.16    262.11

07:44:18       1    1.79   48.59    0.36    0.23    0.00    0.00   49.02    268.92

07:44:18       2    2.19   42.63    0.28    0.16    0.01    0.00   54.73    260.96

07:44:18       3    2.17   68.56    0.34    0.06    0.03    0.00   28.83    271.47
Report CPU utilization using sar command
You can display today’s CPU activity, with sar command:
# sar
Output:
Linux 2.6.9-42.0.3.ELsmp (dellbox.xyz.co.in)         01/13/2007

12:00:02 AM       CPU     %user     %nice   %system   %iowait     %idle

12:10:01 AM       all      1.05      0.00      0.28      0.04     98.64

12:20:01 AM       all      0.74      0.00      0.34      0.38     98.54

12:30:02 AM       all      1.09      0.00      0.28      0.10     98.53

12:40:01 AM       all      0.76      0.00      0.21      0.03     99.00

12:50:01 AM       all      1.25      0.00      0.32      0.03     98.40

01:00:01 AM       all      0.80      0.00      0.24      0.03     98.92

...

.....

..

04:40:01 AM       all      8.39      0.00     33.17      0.06     58.38

04:50:01 AM       all      8.68      0.00     37.51      0.04     53.78

05:00:01 AM       all      7.10      0.00     30.48      0.04     62.39

05:10:01 AM       all      8.78      0.00     37.74      0.03     53.44

05:20:02 AM       all      8.30      0.00     35.45      0.06     56.18

Average:          all      3.09      0.00      9.14      0.09     87.68
Comparison of CPU utilization
The sar command writes to standard output the contents of selected cumulative activity counters in the operating system. The accounting system, based on the values in the count and interval parameters. For example display comparison of CPU utilization; 2 seconds apart; 5 times, use:
# sar -u 2 5
Output (for each 2 seconds. 5 lines are displayed):
Linux 2.6.9-42.0.3.ELsmp (www1lab2.xyz.ac.in)         01/13/2007

05:33:24 AM       CPU     %user     %nice   %system   %iowait     %idle

05:33:26 AM       all      9.50      0.00     49.00      0.00     41.50

05:33:28 AM       all     16.79      0.00     74.69      0.00      8.52

05:33:30 AM       all     17.21      0.00     80.30      0.00      2.49

05:33:32 AM       all     16.75      0.00     81.00      0.00      2.25

05:33:34 AM       all     14.29      0.00     72.43      0.00     13.28

Average:          all     14.91      0.00     71.49      0.00     13.61
Where,
- -u 12 5 : Report CPU utilization. The following values are displayed:
- %user: Percentage of CPU utilization that occurred while executing at the user level (application).
- %nice: Percentage of CPU utilization that occurred while executing at the user level with nice priority.
- %system: Percentage of CPU utilization that occurred while executing at the system level (kernel).
- %iowait: Percentage of time that the CPU or CPUs were idle during which the system had an outstanding disk I/O request.
- %idle: Percentage of time that the CPU or CPUs were idle and the system did not have an outstanding disk I/O request.
To get multiple samples and multiple reports set an output file for the sar command. Run the sar command as a background process using.
# sar -o output.file 12 8 >/dev/null 2>&1 &
Better use nohup command so that you can logout and check back report later on:
# nohup sar -o output.file 12 8 >/dev/null 2>&1 &
All data is captured in binary form and saved to a file (data.file). The data can then be selectively displayed ith the sar command using the -f option.
# sar -f data.file
Task: Find out who is monopolizing or eating the CPUs
Finally, you need to determine which process is monopolizing or eating the CPUs. Following command will displays the top 10 CPU users on the Linux system.
# ps -eo pcpu,pid,user,args | sort -k 1 -r | head -10
OR
# ps -eo pcpu,pid,user,args | sort -r -k1 | less
Output:
%CPU   PID USER     COMMAND

  96  2148 vivek    /usr/lib/vmware/bin/vmware-vmx -C /var/lib/vmware/Virtual Machines/Ubuntu 64-bit/Ubuntu 64-bit.vmx -@ ""

 0.7  3358 mysql    /usr/libexec/mysqld --defaults-file=/etc/my.cnf --basedir=/usr --datadir=/var/lib/mysql --user=mysql --pid-file=/var/run/mysqld/mysqld.pid --skip-locking --socket=/var/lib/mysql/mysql.sock

 0.4 29129 lighttpd /usr/bin/php

 0.4 29128 lighttpd /usr/bin/php

 0.4 29127 lighttpd /usr/bin/php

 0.4 29126 lighttpd /usr/bin/php

 0.2  2177 vivek    [vmware-rtc]

 0.0     9 root     [kacpid]

 0.0     8 root     [khelper]
Now you know vmware-vmx process is eating up lots of CPU power. ps command displays every process (-e) with a user-defined format (-o pcpu). First field is pcpu (cpu utilization). It is sorted in reverse order to display top 10 CPU eating process.
iostat command
You can also use iostat command which report Central Processing Unit (CPU) statistics and input/output statistics for devices and partitions. It can be use to find out your system's average CPU utilization since the last reboot.
# iostatOutput:
Linux 2.6.15.4 (debian)         Thursday 06 April 2006

avg-cpu:  %user   %nice %system %iowait  %steal   %idle

     16.36    0.00    2.99    1.06    0.00   79.59

Device:            tps   Blk_read/s   Blk_wrtn/s   Blk_read   Blk_wrtn

hda               0.00         0.00         0.00         16          0

hdb               6.43        85.57       166.74     875340    1705664

hdc               0.03         0.16         0.00       1644          0

sda               0.00         0.00         0.00         24          0
You may want to use following command, which gives you three outputs every 5 seconds (as previous command gives information since the last reboot):$ iostat -xtc 5 3
GUI tools for your laptops/desktops
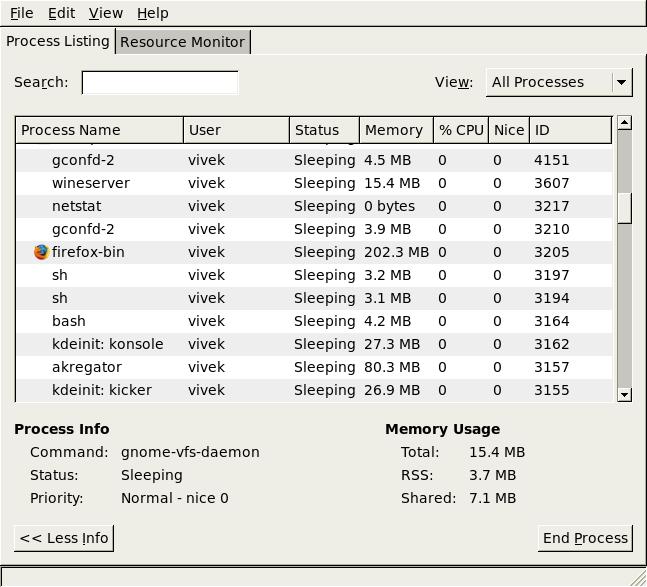
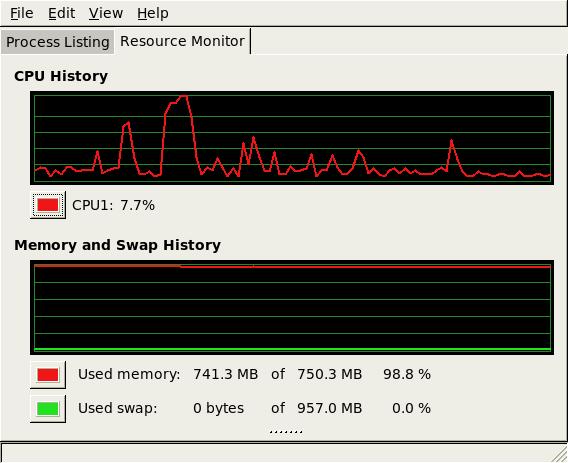
Above tools/commands are quite useful on remote server. For local system with X GUI installed you can try out gnome-system-monitor. It allows you to view and control the processes running on your system. You can access detailed memory maps, send signals, and terminate the processes.
$ gnome-system-monitor
In addition, the gnome-system-monitor provides an overall view of the resource usage on your system, including memory and CPU allocation.
Further readings
- For more information and command option please read man pages of top, iostat, mpstat, sar, ps commands.


