什么是R方?这6张图会让你终身难忘~
什么是R2 ?
在回归模型中,因变量(y)总的方差(信息)可以被称作总平方和(Total sum of squares,TSS),它由两部分组成[1]:
1. 模型可以解释的那部分信息(Model sum of squares, MSS)
2. 模型解释不了的那部分信息,也称为error(Residual sum of squares, RSS)
R2 指的是模型可以解释的那部分信息所占的百分比,即MSS/TSS。
如果R2越大,那该模型能解释的部分也就越多,模型当然就越佳。
上述的概念看上去枯燥,并不是那么有意思。
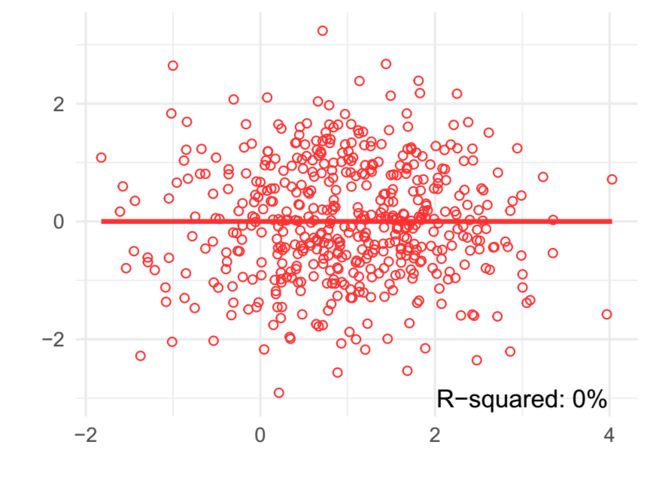
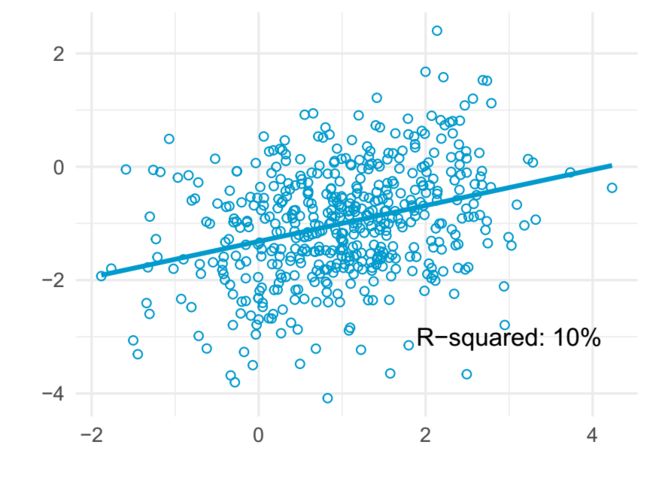
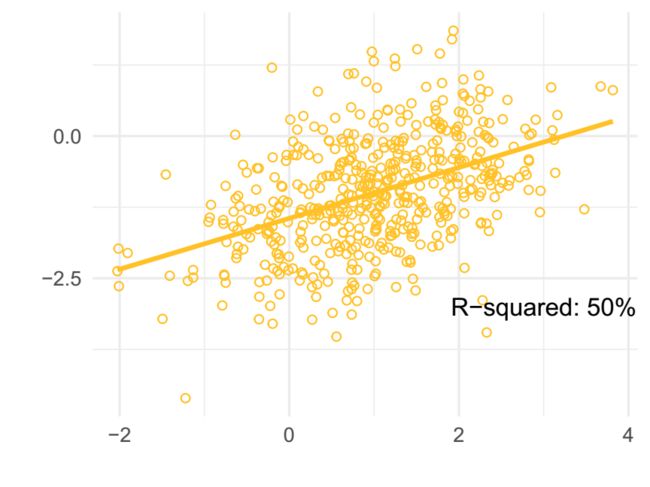
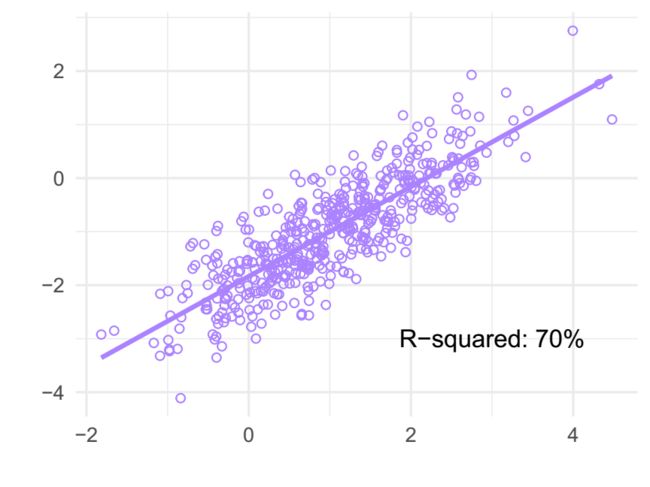
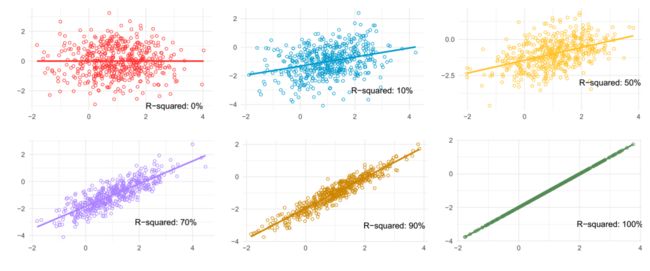
所以,小编接下来将会用图片呈现6个不同大小的R2,有助于了解不同R2到底“长”什么样,一定让你终身难忘~
首先载入所需R包:
# install.packages("correlation")
# install.packages("ggplot2")
# install.packages("patchwork")

library(correlation)   # 用于创建数据
library(ggplot2)
library(patchwork)第一张图:R2 = 0%
mydata_0 <- simulate_simpson(n = 500, r = 0, groups = 1)

p1 <- ggplot(mydata_0, aes(V1, V2)) +
  geom_point(shape = 1, fill = "white", color = "firebrick1") +
  geom_smooth(method = "lm", se = FALSE, color = "firebrick1") +
  theme_minimal() +
  annotate("text", x = 3, y = -3, label = "R-squared: 0%") +
  labs(x = "", y = "")
p1
第二张图: R2 = 10%
mydata_0.1 <- simulate_simpson(n = 500, r = sqrt(0.1), groups = 1)

p2 <- ggplot(mydata_0.1, aes(V1, V2)) +
  geom_point(shape = 1, fill = "white", color = "deepskyblue3") +
  geom_smooth(method = "lm", se = FALSE, color = "deepskyblue3") +
  theme_minimal() +
  annotate("text", x = 3, y = -3, label = "R-squared: 10%") +
  labs(x = "", y = "")
p2
第三张图: R2 = 50%
mydata_0.5 <- simulate_simpson(n = 500, r = sqrt(0.5), groups = 1)

p3 <- ggplot(mydata_0.5, aes(V1, V2)) +
  geom_point(shape = 1, fill = "white", color = "goldenrod1") +
  geom_smooth(method = "lm", se = FALSE, color = "goldenrod1") +
  theme_minimal() +
  annotate("text", x = 3, y = -3, label = "R-squared: 50%") +
  labs(x = "", y = "")
p3
第四张图: R2 = 70%
mydata_0.7 <- simulate_simpson(n = 500, r = sqrt(0.7), groups = 1)

p4 <- ggplot(mydata_0.7, aes(V1, V2)) +
  geom_point(shape = 1, fill = "white", color = "mediumpurple1") +
  geom_smooth(method = "lm", se = FALSE, color = "mediumpurple1") +
  theme_minimal() +
  annotate("text", x = 3, y = -3, label = "R-squared: 70%") +
  labs(x = "", y = "")
p4
第五张图: R2 = 90%
mydata_0.9 <- simulate_simpson(n = 500, r = sqrt(0.9), groups = 1)

p5 <- ggplot(mydata_0.9, aes(V1, V2)) +
  geom_point(shape = 1, fill = "white", color = "orange3") +
  geom_smooth(method = "lm", se = FALSE, color = "orange3") +
  theme_minimal() +
  annotate("text", x = 3, y = -3, label = "R-squared: 90%") +
  labs(x = "", y = "")
p5
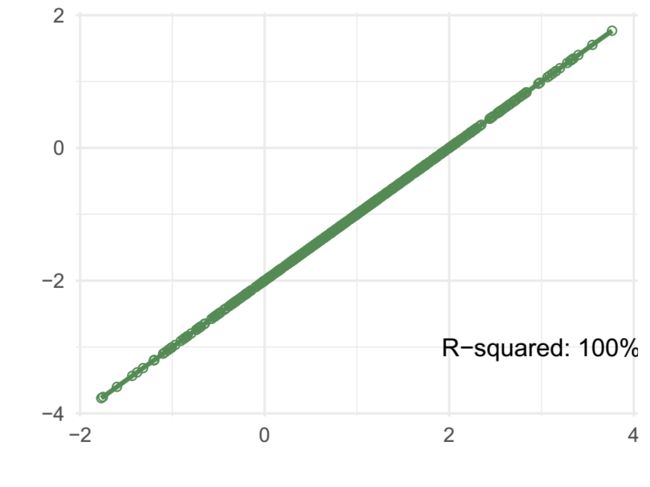
第六张图: R2 = 100%
mydata_1 <- simulate_simpson(n = 500, r = sqrt(1), groups = 1)

p6 <- ggplot(mydata_1, aes(V1, V2)) +
  geom_point(shape = 1, fill = "white", color = "palegreen4") +
  geom_smooth(method = "lm", se = FALSE, color = "palegreen4") +
  theme_minimal() +
  annotate("text", x = 3, y = -3, label = "R-squared: 100%") +
  labs(x = "", y = "")

p6(p1 + p2 + p3) / (p4 + p5 + p6)好啦,今天的内容就到这里。
参考文献
[1]. The Elements of Statistical Learning
![]()
▌声明:本文由R语言和统计首发,如需转载请联系我们
▌编辑:June
▌我们的宗旨是:让R语言和统计变得简单!
往期精品(点击图片直达文字对应教程)
机器学习
后台回复“生信宝典福利第一波”或点击阅读原文获取教程合集


