Thingworx自定义扩展开发(三)- echarts集成
系列
- Thingworx自定义扩展开发(一)- 开发环境搭建、Extension Demo Coding
- Thingworx自定义扩展开发(二)- Widget Demo Coding
- Thingworx自定义扩展开发(三)- echarts集成
这里演示一个简单的集成仪表盘的示例,并进行了简单的数据绑定,其他的类似。
1 准备
Thingworx版本9.1及其相应是SDK,安装好开发环境的Eclipse,echarts 5.2.2(集成时最新版)
2 开发
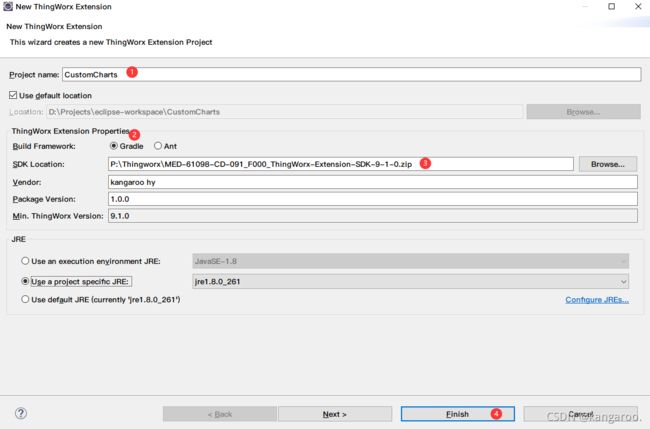
2.1 新建项目
新建一个Thingworx Extension项目:CustomCharts
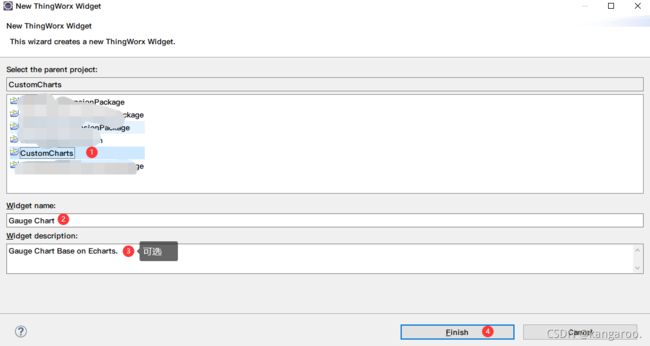
2.2 新建一个widget
9.1版本创建完widget会有一个小bug,< widgetname >.ide.js中的widgetIconUrl返回值会多一个引号,导致导入Thingworx中,组件列表不会显示出图标
2.3 引入echarts
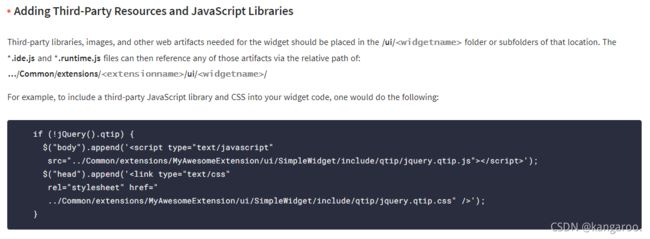
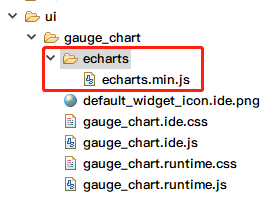
将 下载 后的echarts.min.js引入项目
2.3.1 引入
这里放在ui/gauge_chart/echarts 目录下
2.3.2 配置
编辑 configfiles/metadata.xml配置文件,这里让开发时也生效,是为了在开发时就能直观看到组件的变化(除数据之外的变化)

这里也是一个坑,按照官方的说法,应该是在js中引入,但是很遗憾,引入后可能无效,初始化echarts时会报undefined
2.3.3 编辑 gauge_chart.ide.js
直接上代码,具体看注释
TW.IDE.Widgets.gauge_chart = function() {

	let thisWidget = this;

	this.widgetIconUrl = function() {
		return "../Common/extensions/CustomCharts/ui/gauge_chart/default_widget_icon.ide.png";
	};

	this.widgetProperties = function() {
		return {
			'name' : 'Gauge Chart',
			'description' : 'chart based on echarts',
			'category' : [ 'Data', 'Charts' ],
			/** 自适应支持 */
			'supportsAutoResize' : true,
			'defaultBindingTargetProperty' : 'Data',
			'properties' : {
				'Data' : {
					'isBindingTarget' : true,
					'baseType' : 'NUMBER',
					'defaultValue' : 50
				},
				'DataLabel' : {
					'baseType' : 'STRING',
					'defaultValue' : 'Gauge Chart'
				}
			}
		}
	};

	this.afterSetProperty = function(name, value) {
		//直接返回true,表示任意属性修改,都重新加载组件 [仅限 Mashup Builder - 运行时除外]
		return true;
	};

	this.renderHtml = function() {
		return '';
	};

	this.afterLoad = function() {
		//加载完组件,手动调用this.setProperty()方法同时thingworx以修改组件大小,否则组件将显示100*100大小,传值随意
		this.setProperty('initChart', 'afterLoad');
	};

	this.afterRender = function() {
		/* 初始化eChart实例 */
		thisWidget.chart = echarts.init(document.getElementById(this.jqElementId));
		this.chart.setOption(thisWidget.getOption());
		thisWidget.chart.resize();
		//此处目的同afterLoad()方法
		this.setProperty('initChart', 'afterRender');
	};

	this.getOption = function() {
		//将官方demo扔进来
		let option = {
			tooltip : {
				formatter : '{a}
{b} : {c}%'
			},
			series : [ {
				name : 'Pressure',
				type : 'gauge',
				detail : {
					formatter : '{value}'
				},
				data : [ {
					value : this.properties['Data'],
					name : this.properties['DataLabel']
				} ]
			} ]
		};
		return option;
	};
};
3 使用
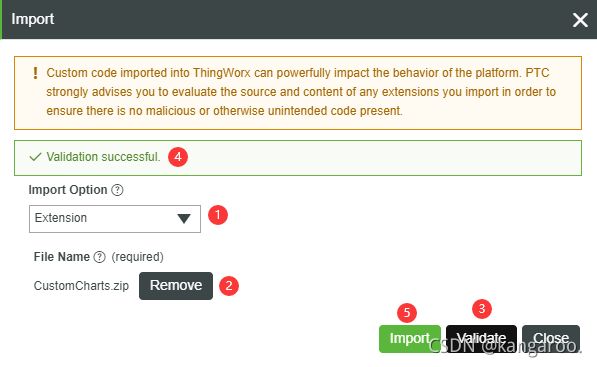
项目打包,生成zip文件,导入Thingworx
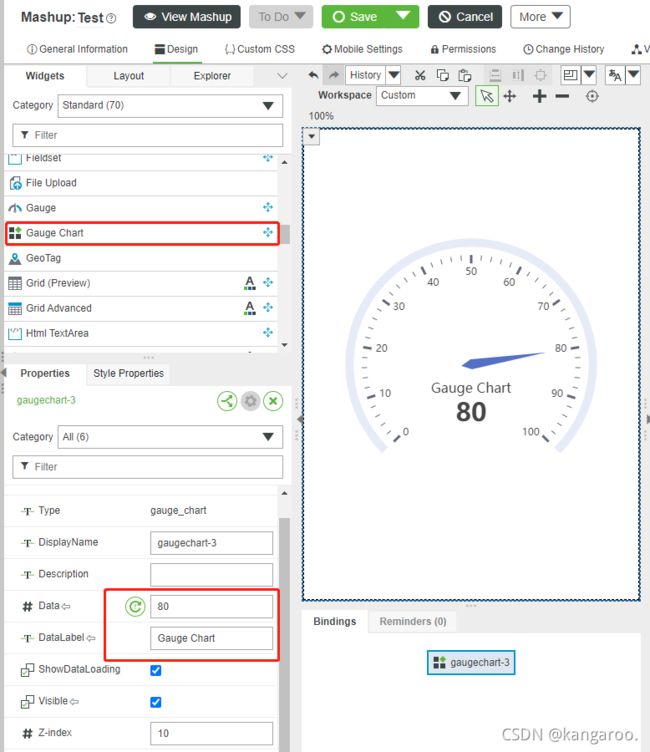
在开发界面引入
运行时文件再写一遍,具体参考官方文档即可:https://support.ptc.com/help/thingworx/platform/r9/en
2022.01.08 更新
很多小伙伴都在问runtime.js怎么写,这里贴一下示例代码,大同小异,以下代码不是最优编码,但是能使用。
TW.Runtime.Widgets.gauge_chart= function () {

	let thisWidget = this;
	const widgetProperties = this.properties;

	let dataRows = [];

	let actualSourceProperty = "";

	this.renderHtml = function () {
		return 	'';
	};

	this.afterRender = function () {
		this.initEcharts();
	};

	this.initEcharts = function() {
		/* 初始化eChart实例 */
		thisWidget.chart = echarts.init(document.getElementById(this.jqElementId));
		this.chart.setOption(thisWidget.getOption());
		thisWidget.chart.resize();
	};

	this.updateProperty = function (updatePropertyInfo) {
		let targetProperty = updatePropertyInfo.TargetProperty;
		let sourceProperty = updatePropertyInfo.SourceProperty;
		let actualData = [];
		switch (targetProperty) {
		case 'Data':
			// 赋值全局变量,方便自定义方法获取数据
			dataRows = updatePropertyInfo.ActualDataRows;
			actualSourceProperty = sourceProperty;
			break;
		default:
			break;
		}
		// 更新图表
		this.chart.setOption(thisWidget.getOption());
		thisWidget.chart.resize();
	};

	this.getOption = function() {
		//将官方demo扔进来
		let option = {
			tooltip : {
				formatter : '{a}
{b} : {c}%'
			},
			series : [ {
				name : 'Pressure',
				type : 'gauge',
				detail : {
					formatter : '{value}'
				},
				data : this.chartSeriesData()
			} ]
		};
		return option;
	};

	this.chartSeriesData = function() {
		let data = [];
		if (dataRows.length > 0) {
			let row = dataRows[0];
			let ob = new Object();
			ob.name = widgetProperties['DataLabel'];
			for ( let j in row) {
				if(actualSourceProperty == j){
					ob.value = row[j];
				}
			}
			data.push(ob);
		}
		return data;
	};

	this.runtimeProperties = function() {
		return {
			'needsDataLoadingAndError' : true,
			'supportsAutoResize' : true,
			'borderWidth' : 0
		};
	};

	this.resize = function(width, height) {
		thisWidget.chart.resize(width, height);
	};
};
相当于喂到嘴里了,如果这都还不会,那就用钱买现成的吧,购买联系QQ:326170945
