2023年mathorcup杯A题代码小技巧总结
写篇杂文,不属于我的任何一个栏目,没啥案例含义,主要是记录一下mathorcup杯期间写的代码技巧。
mathorcup杯大部分都是组合优化问题,这让我擅长的机器学习都深度学习毫无作用.......
还好这个A题是可以遍历求所有解的,下面就是我怎么做的一些代码。
手写第一问
第一问就是找100张卡10种阈值,1000种情况哪种最好,遍历算一遍就行了。
导入包:
import numpy as np
import pandas as pd
import matplotlib.pyplot as plt
import seaborn as sns

plt.rcParams ['font.sans-serif'] ='SimHei'               #显示中文
plt.rcParams ['axes.unicode_minus']=False               #显示负号
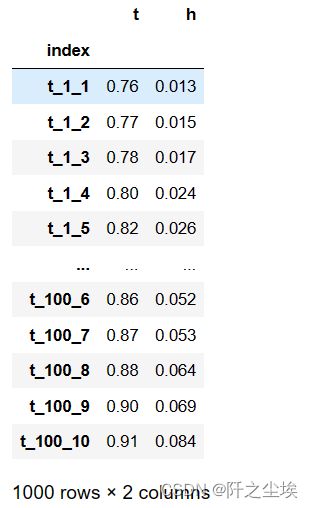
读取数据,转为列格式
df=pd.read_csv('../附件/附件1:data_100.csv')
df1=df.filter(regex='t', axis=1).melt().assign(num=[i+1 for i in range(10)]*100)
#df1                                             #.set_index('variable')  #.unstack().reset_index()
df1['index']=df1['variable'].str.cat(df1['num'].astype(str), sep='_')
df2=df.filter(regex='h', axis=1).melt().assign(num=[i+1 for i in range(10)]*100)
df2['index']=df2['variable'].str.cat(df2['num'].astype(str), sep='_')
data=pd.DataFrame()
data['index']=df1['index']
data['t']=df1['value']
data['h']=df2['value']
data=data.set_index('index')
data
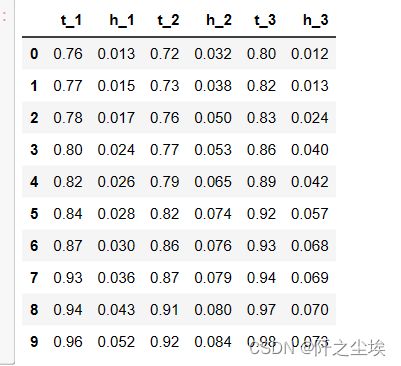
t是通过率,h是坏账率 。前面表示的是卡号和阈值。
定义目标函数
def deal_xht(x,t,h,L=0.08):
     return x*t*(L-L*h-h)
遍历结果,然后储存
sum_result=[]
for i in range(len(data)):
    x=np.zeros((1000,))
    x[i]=1
    sum_result.append(sum([deal_xht(x,t=th[0],h=th[1]) for x ,th in zip(x,data.to_numpy())]))
找到最大的
index=np.array(sum_result).argmax()
index
结果是49张卡的一号阈值最好。
查看对应的坏账率和通过率
data.iloc[index,:]转为结果为数据框
data1=pd.DataFrame(sum_result,index=data.index,columns=['利润']).reset_index().assign(标签=lambda d:d['index'].str.split('_'))\
.assign(阈值=lambda d:d['标签'].apply(lambda x:x[2])).assign(卡号=lambda d:d['标签'].apply(lambda x:x[1])).drop(columns=['index','标签'])

data1['阈值']=data1['阈值'].astype('int')
data1['卡号']=data1['卡号'].astype('int')
data1=data1.pivot(index='阈值', columns='卡号', values='利润').sort_index(sort_remaining=False)
查看其中10列
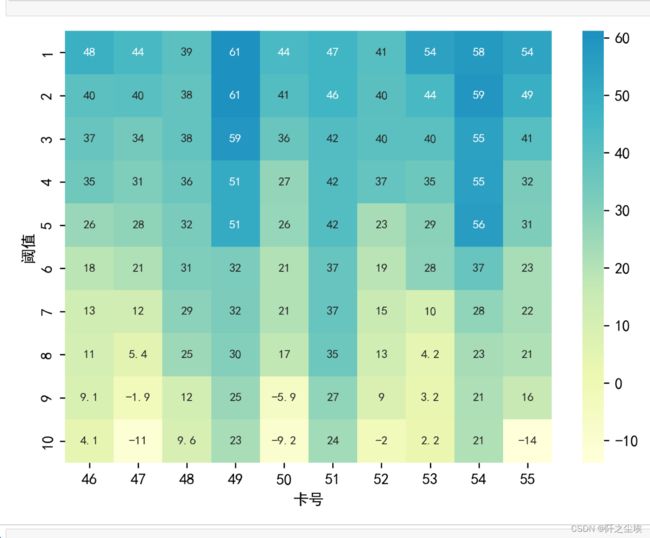
data1.iloc[:,45:55]*1000画个热力图吧
import matplotlib.colors as mcolors

# 定义黄蓝渐变色
colors = ['#ffffd9', '#edf8b1', '#c7e9b4', '#7fcdbb', '#41b6c4', '#1d91c0']
my_cmap = mcolors.LinearSegmentedColormap.from_list('my_colormap', colors)

plt.figure(figsize=(7,5),dpi=256)
sns.heatmap((data1.iloc[:,45:55]*1000).round(3), cmap=my_cmap, annot=True, annot_kws={"size": 8})
plt.savefig('第一问.png')
还别说,这个chatgpt给的颜色还很好看。
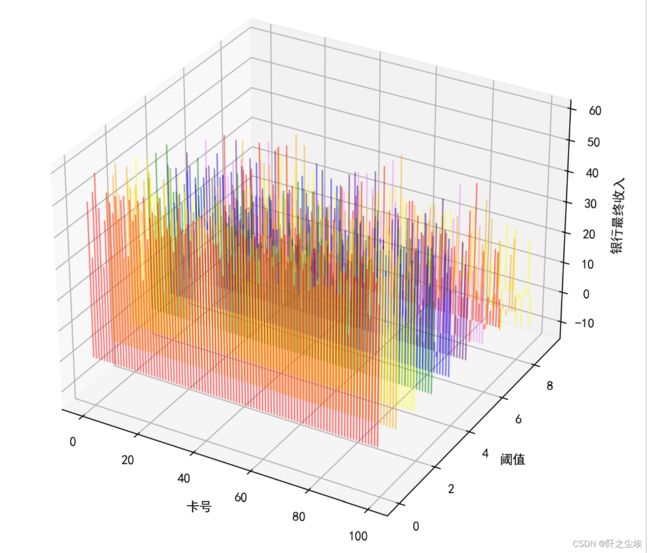
画个三维图:
data1=data1*1000
from mpl_toolkits.mplot3d import Axes3D
fig = plt.figure(figsize=(8,8),dpi=256)
ax = fig.add_subplot(111, projection='3d')

colors=['red', 'orange', 'yellow', 'green', 'blue', 'indigo', 'violet']*2

# 绘制3D柱状图
for i in range(data1.shape[0]):
    xs = [j for j in range(data1.shape[1])]
    ys = [i] * data1.shape[1]
    zs = data1.iloc[i, :].tolist()
    ax.bar(xs, zs, zs=ys, zdir='y', alpha=0.5,color=colors[i],width=0.5)

# 设置坐标轴标签
ax.set_xlabel('卡号')
ax.set_ylabel('阈值')
ax.set_zlabel('银行最终收入')
plt.savefig('第一问三维图.png')
# 显示图像
plt.show()
可以看到阈值较小的时候银行倾向于有一个更多的收入。
QUBO求第一问
上面是枚举,遍历了所有可能性,暴力搜索。下面是题目要求的QUBO模型求解。
重新读取数据
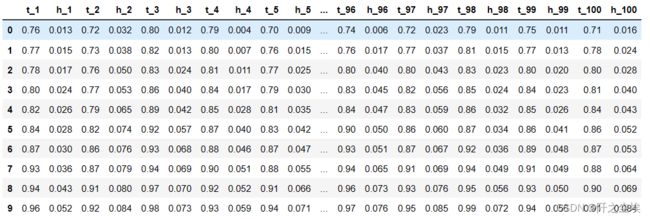
df=pd.read_csv('../附件/附件1:data_100.csv')
df
这个是一个小技巧,可以筛选列名称里面含有h或者t的列的方法
df1=df.filter(regex='t', axis=1)
df2=df.filter(regex='h', axis=1)
df2
使用pyqubo库变换为QUBO问题,使用neal库里面的量子退火求解
import pyqubo
from pyqubo import Binary,Array
import neal
#x = Array.create('x', shape=(100,), vartype='BINARY')
x= Array.create('x', shape=(10,100), vartype='BINARY')
上面x是决策变量,下面定义目标函数
def deal_xht(x=x,t=df1.to_numpy(),h=df2.to_numpy(),L=0.08):
     return x*t*(L-L*h-h)
加入罚项
H =-sum(sum(deal_xht())) + 100*(sum(sum(x))-1)**2编译模型
model = H.compile()
bqm =model.to_bqm()
求解
# 使用模拟退火求解 QUBO 问题
sa = neal.SimulatedAnnealingSampler()
sampleset = sa.sample(bqm, num_reads=1000)

decoded_samples = model.decode_sampleset(sampleset)
best_sample = min(decoded_samples, key=lambda x: x.energy)
print(best_sample.sample)
结果很乱,要筛选一下查看:
for k,v in dict(best_sample.sample).items():
    if v==1:
        min_num=k
        print(k)
可以看到求解出来的还是49号卡第一个阈值。
手写第二问
选定三张卡,然后找最优阈值组合
还是选读取数据
df=pd.read_csv('../附件/附件1:data_100.csv').iloc[:,:6]
df
又是一个筛选技巧,筛选包含"_1"或者"_2"结尾的列
df1=df.filter(regex='\_1$', axis=1)
df2=df.filter(regex='\_2$', axis=1)
df3=df.filter(regex='\_3$', axis=1)
定义目标函数
def deal(th1,th2,th3,L=0.08):
    sum_t=th1[0]*th2[0]*th3[0]
    mean_h=(th1[1]+th2[1]+th3[1])/3
    return L*sum_t*(1-mean_h)-sum_t*mean_h
遍历找最优
s=time.time()

sum_result=[]
sum_max=[]
sum_yuzhi=[]
for i in range(10):
    for j in range(10):
        for z in range(10):
            a=np.zeros((10,3))
            a[i,0]=1
            a[j,1]=1
            a[z,2]=1
            #print(a)
            x1=a[:,0]   ;  x2=a[:,1]   ;  x3= a[:,2]
            th1=df1[x1!= 0].to_numpy()[0]  ;th2=df2[x2!= 0].to_numpy()[0]; th3=df3[x3!= 0].to_numpy()[0]
            #print(th1)
            re=deal(th1,th2,th3)
            sum_result.append(re)
            sum_max.append(a)
            sum_yuzhi.append([i,j,z,re])
#             break
#         break
#     break
e=time.time()
e-s
运行花了0.34秒
查看最大的情况
max_re=np.array([k for k in sum_result]).max()
index=np.array([k for k in sum_result]).argmax()
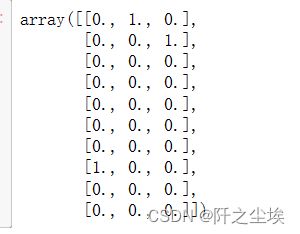
print(max_re,index)sum_max[index]阈值为8,1,2时候最大。
遍历的所有情况的最大收入转为数据框,方便后面画图
from mpl_toolkits.mplot3d import Axes3D
# 创建3D坐标轴
fig = plt.figure(figsize=(8,8),dpi=256)
ax = fig.add_subplot(111, projection='3d')

# 绘制散点图
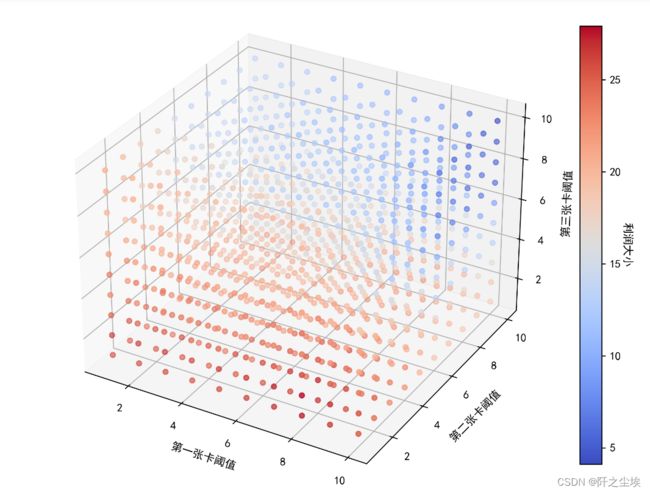
scatter=ax.scatter(data1['第一张卡阈值'], data1['第二张卡阈值'], data1['第三张卡阈值'], c=data1['利润'], cmap='coolwarm')

# 设置坐标轴标签
ax.set_xlabel('第一张卡阈值')
ax.set_ylabel('第二张卡阈值')
ax.set_zlabel('第三张卡阈值')

cbar = plt.colorbar(scatter,shrink=0.7)
cbar.set_label('利润大小', fontsize=10, rotation=-90, labelpad=10)

plt.tight_layout()
plt.savefig('第二问.png')
plt.show()
