vue 双y轴echarts x轴显示省略号 鼠标滑入显示提示窗
需求:鼠标移入x轴显示全部文字并且是悬浮窗的形式
效果图
上代码 cv直接用
html代码
js代码
悬浮窗核心代码
reminder(myChart) {
      // params.componentType == 'xAxis'或者  params.componentType == 'yAxis' 看你需求是x还是y
      // 显示悬浮窗 获取div 有就不创建没有创建
      var divData = document.getElementById("extensionId");
      if (!divData) {
        var div = document.createElement("div");
        div.setAttribute("id", "extensionId");
        div.style.display = "block";
        document.querySelector("html").appendChild(div);
      }
      // 鼠标移入事件
      myChart.on("mouseover", function(params) {
        if (params.componentType == "xAxis") {
          var divData = document.querySelector("#extensionId");
          //显示的样式 自己写就行
          var elementStyle =
            "position: absolute;z-index: 99999;color: #000;font-size: 12px;padding: 5px;display: inline;border-radius: 4px;background-color: #fff;box-shadow: rgba(0, 0, 0, 0.3) 2px 2px 8px;border:1px solid #000";
          divData.style.cssText = elementStyle;
          divData.innerHTML = params.value;
          document.querySelector("html").onmousemove = function(event) {
            var divData = document.querySelector("#extensionId");
            var xx = event.pageX + 40; //x位置 自己调整
            var yy = event.pageY - 20; //y位置 自己调整
            divData.style.top = yy + "px";
            divData.style.left = xx + "px";
          };
        }
      });
      // 鼠标移出事件
      myChart.on("mouseout", function(params) {
        if (params.componentType == "xAxis") {
          var divData = document.querySelector("#extensionId");
          divData.style.cssText = "display:none";
        }
      });
    },
柱状图核心代码
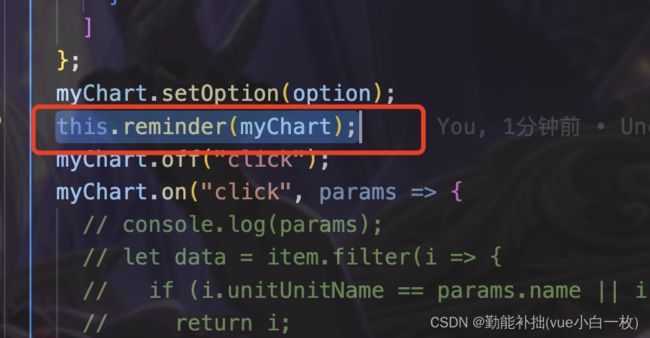
在下面得到echarts之后 传入这个方法 当然也可以写到一起
柱状图代码
// 柱状图 评价标准echarts
    barEchartData() {
      var data = [
        {
          evaluation: "安全管理体系建设与安全责任制落实",
          pointcount: 50,
          unitcount: 14
        },
        {
          evaluation: "安全管理体系建设与安全责任制落实",
          pointcount: 50,
          unitcount: 14
        },
        {
          evaluation: "安全管理体系建设与安全责任制落实",
          pointcount: 50,
          unitcount: 14
        },
        {
          evaluation: "安全管理体系建设与安全责任制落实",
          pointcount: 50,
          unitcount: 14
        },
        {
          evaluation: "安全管理体系建设与安全责任制落实",
          pointcount: 50,
          unitcount: 14
        },
        {
          evaluation: "安全管理体系建设与安全责任制落实",
          pointcount: 50,
          unitcount: 14
        },
        {
          evaluation: "安全管理体系建设与安全责任制落实",
          pointcount: 50,
          unitcount: 14
        },
        {
          evaluation: "安全管理体系建设与安全责任制落实",
          pointcount: 50,
          unitcount: 14
        },
        {
          evaluation: "安全管理体系建设与安全责任制落实",
          pointcount: 50,
          unitcount: 14
        },
        {
          evaluation: "安全管理体系建设与安全责任制落实",
          pointcount: 50,
          unitcount: 14
        },
        {
          evaluation: "安全管理体系建设与安全责任制落实",
          pointcount: 50,
          unitcount: 14
        },
        {
          evaluation: "安全管理体系建设与安全责任制落实",
          pointcount: 50,
          unitcount: 14
        },
      ];
      var xData = [];
      var yProductNum = [];
      var yNumber = [];
      var myChart = echarts.init(document.getElementById("histogramEchart"));
      myChart.clear();
      data.forEach(it => {
        xData.push(it.evaluation);
        if (!it.pointcount) {
          it.pointcount = 0;
        }
        if (!it.unitcount) {
          it.unitcount = 0;
        }
        yProductNum.push(it.unitcount);
        yNumber.push(it.pointcount);
      });
      // 指定图表的配置项和数据
      var option = {
        tooltip: {
          trigger: "axis",
          backgroundColor: "rgba(0,0,0,0)", // 提示框浮层的背景颜色。
          position: function(point, params, dom, rect, size) {
            var x = 0; // x坐标位置
            var y = 0; // y坐标位置
            // 当前鼠标位置
            var pointX = point[0];
            var pointY = point[1];
            // 提示框大小
            var boxWidth = size.contentSize[0];
            var boxHeight = size.contentSize[1];

            // boxWidth > pointX 说明鼠标左边放不下提示框
            if (boxWidth > pointX) {
              x = pointX + 10;
            } else {
              // 左边放的下
              x = pointX - boxWidth - 10;
            }

            // boxHeight > pointY 说明鼠标上边放不下提示框
            if (boxHeight > pointY) {
              y = 5;
            } else {
              // 上边放得下
              y = pointY - boxHeight;
            }
            return [x, y];
          },

          formatter: function(params) {
            var res = "";
            res += `


                ${String(params[0].name).replace(/(.{10})/g, "$1
")}


                    总单位选择


                ${
                  params[0].value
                }


                    总扣分


                    ${params[1].value}


            `;
            return res;
          }
        },
        grid: {
          //调整统计图上下左右边距
          top: 30,
          right: 30,
          left: 30,
          bottom: 40
        },
        legend: {
          orient: "horizontal",
          x: "center",
          y: "top",
          textStyle: {
            color: "#989898"
          },
          itemWidth: this.$fontChart(0.12),
          itemHeight: this.$fontChart(0.12),
          align: "left"
        },
        dataZoom: [
          {
            id: "dataZoomX",
            show: true,
            showDetail: false,
            height: this.$fontChart(0.1),
            xAxisIndex: [0],
            bottom: 3,
            startValue: 0,
            endValue: 15,
            handleStyle: {
              color: "#d3dee5"
            },
            textStyle: {
              color: "#fff"
            },
            borderColor: "#90979c"
          }
        ],
        xAxis: [
          {
            type: "category",
            data: xData,
            axisPointer: {
              type: "shadow"
            },
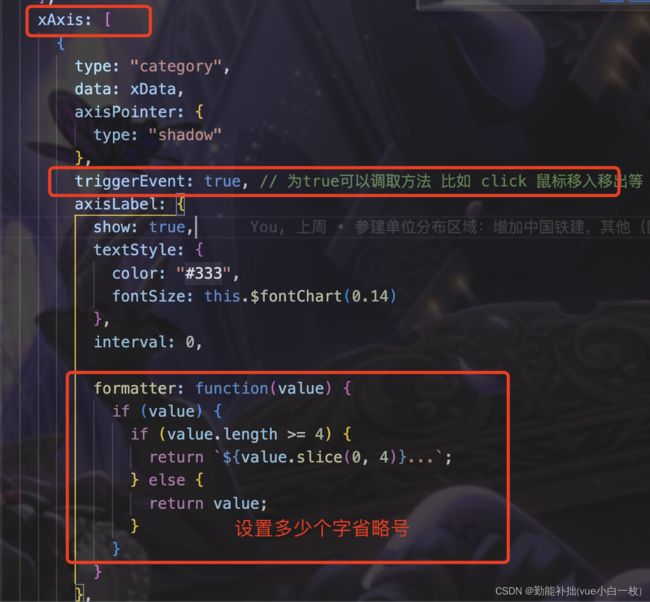
            triggerEvent: true,
            axisLabel: {
              show: true,
              textStyle: {
                color: "#333",
                fontSize: this.$fontChart(0.14)
              },
              interval: 0,

              formatter: function(value) {
                if (value) {
                  if (value.length >= 4) {
                    return `${value.slice(0, 4)}...`;
                  } else {
                    return value;
                  }
                }
              }
            },
            axisLine: {
              // X轴线的颜色
              lineStyle: {
                color: "#979797",
                width: 1
              }
            }
          }
        ],
        yAxis: [
          {
            splitLine: {
              //控制刻度横线的显示
              show: false
            },
            type: "value",
            name: "数量",
            nameTextStyle: {
              ameLocation: "start",
              fontSize: this.$fontChart(0.14)
            },
            axisLabel: {
              formatter: "{value}",
              show: true,
              textStyle: {
                color: "#333",
                fontSize: this.$fontChart(0.14)
              }
            },
            axisLine: {
              // Y轴线的颜色、和轴线的宽度
              lineStyle: {
                color: "#979797",
                width: 1
              }
            }
          },
          {
            splitLine: {
              show: false
            },
            name: "扣分",
            type: "value",
            nameTextStyle: {
              fontSize: this.$fontChart(0.14)
            },
            axisLabel: {
              formatter: "{value}",
              show: true,
              textStyle: {
                color: "#333",
                fontSize: this.$fontChart(0.14)
              }
            },
            axisLine: {
              lineStyle: {
                color: "#979797",
                width: 1
              }
            }
          }
        ],
        series: [
          {
            name: "选择",
            type: "bar",
            barWidth: this.$fontChart(0.15),
            yAxisIndex: 0,
            data: yProductNum,
            itemStyle: {
              //双Y轴B柱的柱体颜色
              normal: {
                color: new echarts.graphic.LinearGradient(0, 0, 0, 1, [
                  { offset: 0, color: "#1887EF" },
                  { offset: 1, color: "#62B0F9" }
                ])
              }
            }
          },

          {
            name: "扣分",
            type: "bar",
            barWidth: this.$fontChart(0.15),
            yAxisIndex: 1,
            data: yNumber,
            itemStyle: {
              //双Y轴A柱的柱体颜色
              normal: {
                // 颜色渐变
                color: new echarts.graphic.LinearGradient(0, 0, 0, 1, [
                  { offset: 0, color: "#00B09A" },
                  { offset: 1, color: "#27DDC6" }
                ])
              }
            }
          }
        ]
      };
      myChart.setOption(option);
      this.reminder(myChart);
      myChart.off("click");
      myChart.on("click", params => {
         //点击事件
      });
      myChart.resize();
      window.addEventListener("resize", function() {
        myChart.resize();
      });
    }


