Sinkhorn-Knopp算法
Sinkhorn-Knopp是为了解决最优传输问题所提出的。
Sinkhorn算法原理
最优运输问题的目标就是以最小的成本将一个概率分布转换为另一个概率分布。即将概率分布 c 以最小的成本转换到概率分布 r,此时就要获得一个分配方案 P ∈ R n × m
其中需满足以下条件:
P 的行和服从分布 r
P 的列和服从分布 c
因此在分布 r 、c 约束下, P 的解空间可以做如下定义:

同时希望最小化转换成本,即需要一个成本矩阵(cost matrix)M。于是就有了最优传输问题的公式化表示:

此时为Wasserstein metric 或earth mover distance(EMD 推土机距离)代价函数。
Sinkhorn距离是对推土机距离的一种改进,在其基础上引入了熵正则化项,则代价函数表示为:
上式两侧对Pij求导

令其为0可得:

这是在无约束条件下求得的关联矩阵,若考虑约束条件,则上式变为:

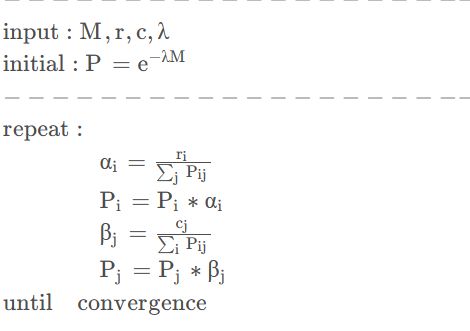
其中α i 和 β j 分别是是的行和列满足约束的因子。
伪代码如下:
实现流程
首先是M定义的为cost矩阵。
求得P值: P = np.exp(-lam * M) # (8, 5)
P /= P.sum()  # 归一化
u = np.zeros(n) # (8, )
np.abs 为对数组中的每一个元素求其绝对值。
    while np.max(np.abs(u - P.sum(1))) > eplison: # 这里是用行和判断收敛
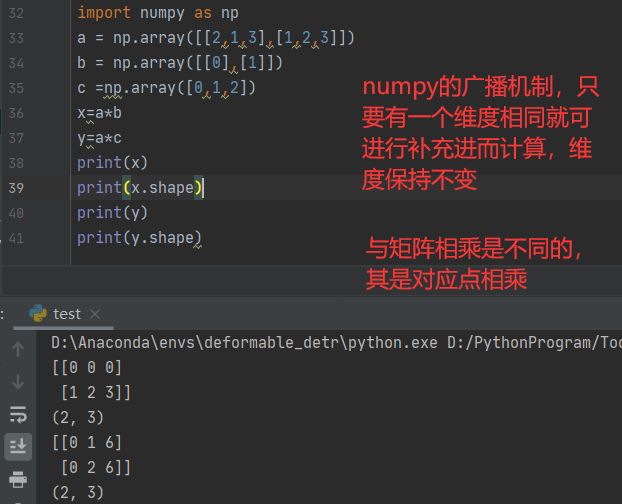
        # 对行和列进行缩放,使用到了numpy的广播机制,不了解广播机制的同学可以去百度一下
        u = P.sum(1) # 行和 (8, )
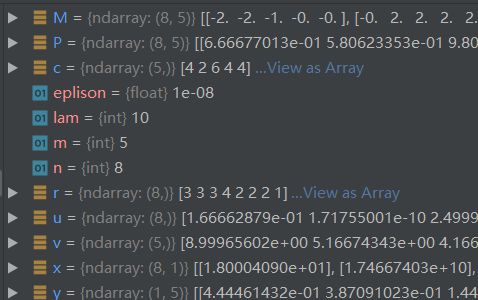
        x=(r / u).reshape((-1, 1)) # 缩放行元素,使行和逼近r
        P *= x
        v = P.sum(0) # 列和 (5, )
        y=(c / v).reshape((1, -1)) # 缩放列元素,使列和逼近c
        P *= y
广播机制计算
代码实现
import numpy as np
import pandas as pd
import matplotlib.pyplot as plt
r = np.array([3, 3, 3, 4, 2, 2, 2, 1])
c = np.array([4, 2, 6, 4, 4])
M = np.array(
    [[2, 2, 1, 0, 0],
    [0, -2, -2, -2, -2],
    [1, 2, 2, 2, -1],
    [2, 1, 0, 1, -1],
    [0.5, 2, 2, 1, 0],
    [0, 1, 1, 1, -1],
    [-2, 2, 2, 1, 1],
    [2, 1, 2, 1, -1]],
    dtype=float)
M = -M # 将M变号,从偏好转为代价
def compute_optimal_transport(M, r, c, lam, eplison=1e-8):
    """
    Computes the optimal transport matrix and Slinkhorn distance using the
    Sinkhorn-Knopp algorithm

    Inputs:
        - M : cost matrix (n x m)
        - r : vector of marginals (n, )
        - c : vector of marginals (m, )
        - lam : strength of the entropic regularization
        - epsilon : convergence parameter

    Outputs:
        - P : optimal transport matrix (n x m)
        - dist : Sinkhorn distance
    """
    n, m = M.shape  # 8, 5
    P = np.exp(-lam * M) # (8, 5)
    P /= P.sum()  # 归一化
    u = np.zeros(n) # (8, )
    # normalize this matrix
    while np.max(np.abs(u - P.sum(1))) > eplison: # 这里是用行和判断收敛
        # 对行和列进行缩放,使用到了numpy的广播机制,不了解广播机制的同学可以去百度一下
        u = P.sum(1) # 行和 (8, )
        P *= (r / u).reshape((-1, 1)) # 缩放行元素,使行和逼近r
        v = P.sum(0) # 列和 (5, )
        P *= (c / v).reshape((1, -1)) # 缩放列元素,使列和逼近c
    return P, np.sum(P * M) # 返回分配矩阵和Sinkhorn距离
lam = 10
P, d = compute_optimal_transport(M,r,c, lam=lam)
print(P)
partition = pd.DataFrame(P, index=np.arange(1, 9), columns=np.arange(1, 6))
print(partition)
ax = partition.plot(kind='bar', stacked=True)
plt.show()
print('Sinkhorn distance: {}'.format(d))
ax.set_ylabel('portions')
ax.set_title('Optimal distribution ($\lambda={}$)'.format(lam))


