机器学习 监督学习 Week1
Lab01 linear regression with one variable
import numpy as np
import matplotlib.pyplot as plt
plt.style.use('./deeplearning.mplstyle')
- NumPy, a popular library for scientific computing
- Matplotlib, a popular library for plotting data
plt.style.use()是 Matplotlib 库中用于设置绘图样式的函数。通过使用
plt.style.use()函数,我们可以方便地应用各种预定义的风格或自定义的样式表。Matplotlib 提供了许多内置风格表,包括'default'(默认)、'ggplot'、'seaborn'等。此外,你还可以创建和使用自己的样式表。
# x_train is the input variable (size in 1000 square feet)
# y_train is the target (price in 1000s of dollars)
x_train = np.array([1.0, 2.0])
y_train = np.array([300.0, 500.0])
print(f"x_train = {x_train}")
print(f"y_train = {y_train}")
NDArray和list的区别:
内存占用:ndarray 占用的内存相对较小,因为它是在一个连续的块中分配并保存数据的。列表则不同,它由多个对象所组成,并且保存每个对象的引用。这意味着,对于相同数量的数据,列表需要更多的内存空间。
可变性:列表是可变对象,它允许添加、删除或修改元素。相反,ndarray 是不可变对象,你只能通过创建一个新的数组来改变其内容。 这使得 ndarray 更加适用于数值计算,因为它们可以充分发挥硬件支持的优化技术(如向量化运算),从而提高代码的执行效率。
访问速度:由于 ndarray 存储数据是连续和紧凑的,因此它的访问速度要快于列表。与此相比,列表的元素存储位置可能会散布在内存中不同的位置,因此每次访问列表时都需要先遍历列表中的元素指针,然后到内存中找到相应的数据才能读取。
数据类型:ndarray 可以保存同一种数据类型的序列,这使得许多针对数值计算优化的库(如 NumPy 和 SciPy 等)可以更加高效地处理数据。而在列表中,则可以包含不同类型的对象,例如字符串、整数和浮点数等。
x_train和y_train是NDArray
np.array() 创建数组的几种常见方式:
1.从 Python 列表或元组创建:
import numpy as np

# 从 Python 列表创建一维数组
a = np.array([1, 2, 3])
print(a)    # 输出: [1 2 3]

# 从 Python 列表创建二维数组(矩阵)
b = np.array([[1, 2, 3], [4, 5, 6]])
print(b)
# 输出:
# [[1 2 3]
#  [4 5 6]]
2.使用函数
np.zeros()和np.ones()创建全零或全一数组:import numpy as np # 创建一个长度为5的全零数组 a = np.zeros(5) print(a) # 输出: [0. 0. 0. 0. 0.] # 创建一个形状为 2×3 的全一数组(矩阵) b = np.ones((2,3)) print(b) # 输出: # [[1. 1. 1.] # [1. 1. 1.]]3.使用函数
np.arange()创建等差数列:import numpy as np # 创建一个值域为[0,9]的整数数组 a = np.arange(10) print(a) # 输出: [0 1 2 3 4 5 6 7 8 9] # 创建一个值域为[1,10],公差为2的整数数组 b = np.arange(1, 11, 2) print(b) # 输出: [1 3 5 7 9]4.使用函数
np.linspace()创建等分数列:import numpy as np # 创建一个值域为[0,1],长度为5的等分数列 a = np.linspace(0, 1, 5) print(a) # 输出: [0. 0.25 0.5 0.75 1. ] # 创建一个值域为[1,10],长度为4的等分数列 b = np.linspace(1, 10, 4) print(b) # 输出: [ 1. 4. 7. 10.]5.NumPy 还提供了很多其他创建数组的方法,例如随机数生成、从文件读取数据等。
# m is the number of training examples
print(f"x_train.shape: {x_train.shape}")
m = x_train.shape[0]
print(f"Number of training examples is: {m}")

#另一种方法
# m is the number of training examples
m = len(x_train)
print(f"Number of training examples is: {m}")
Numpy arrays have a `.shape` parameter.
`x_train.shape` returns a python tuple with an entry for each dimension.
`x_train.shape[0]` is the length of the array and number of examples as shown below.
i = 0 # Change this to 1 to see (x^1, y^1)

x_i = x_train[i]
y_i = y_train[i]
print(f"(x^({i}), y^({i})) = ({x_i}, {y_i})")
(x^(0), y^(0)) = (1.0, 300.0)
x^(0)代表第0组数据的input
# Plot the data points
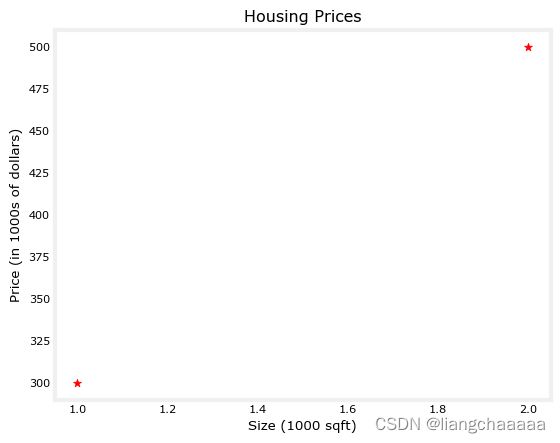
plt.scatter(x_train, y_train, marker='*', c='r')
# Set the title
plt.title("Housing Prices")
# Set the y-axis label
plt.ylabel('Price (in 1000s of dollars)')
# Set the x-axis label
plt.xlabel('Size (1000 sqft)')
plt.show()
The function arguments `marker` and `c` show the points as red crosses (the default is blue dots).
![]()
#手动赋值
w = 100
b = 100
print(f"w: {w}")
print(f"b: {b}")
将所有数据进行计算
def compute_model_output(x, w, b):
    """
    Computes the prediction of a linear model
    Args:
      x (ndarray (m,)): Data, m examples
      w,b (标量)    : 模型参数
    Returns
      y (ndarray (m,)): target values
    """
    m = x.shape[0]
    f_wb = np.zeros(m)
    for i in range(m):
        f_wb[i] = w * x[i] + b

    return f_wb
数据可视化
tmp_f_wb = compute_model_output(x_train, w, b,)

# Plot our model prediction
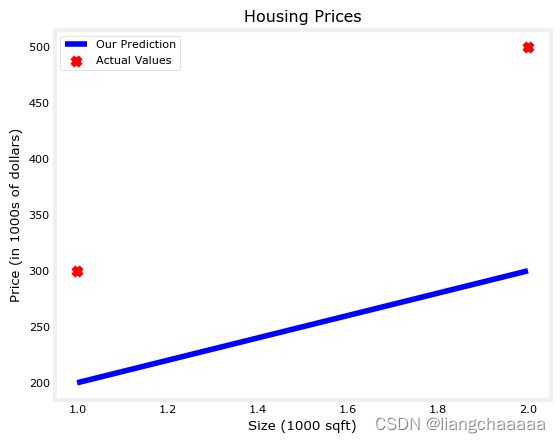
plt.plot(x_train, tmp_f_wb, c='b',label='Our Prediction')

# Plot the data points
plt.scatter(x_train, y_train, marker='x', c='r',label='Actual Values')

# Set the title
plt.title("Housing Prices")
# Set the y-axis label
plt.ylabel('Price (in 1000s of dollars)')
# Set the x-axis label
plt.xlabel('Size (1000 sqft)')
plt.legend()
plt.show()
As you can see, setting w = 100 and b = 100 does not result in a line that fits our data.
Try w = 200 and b = 100
有了基本模型后,我们可以进行预测
w = 200
b = 100
x_i = 1.2
cost_1200sqft = w * x_i + b

print(f"${cost_1200sqft:.0f} thousand dollars")
$340 thousand dollars
Lab02 Cost Function
import numpy as np
%matplotlib widget
import matplotlib.pyplot as plt
from lab_utils_uni import plt_intuition, plt_stationary, plt_update_onclick, soup_bowl
plt.style.use('./deeplearning.mplstyle')![]()
x_train = np.array([1.0, 2.0])           #(size in 1000 square feet)
y_train = np.array([300.0, 500.0])           #(price in 1000s of dollars)
转化成NDArray格式
#计算代价函数J
def compute_cost(x, y, w, b):
    """
    Computes the cost function for linear regression.

    Args:
      x (ndarray (m,)): Data, m examples
      y (ndarray (m,)): target values
      w,b (scalar)    : model parameters

    Returns
        total_cost (float): The cost of using w,b as the parameters for linear regression
               to fit the data points in x and y
    """
    # number of training examples
    m = x.shape[0]

    cost_sum = 0
    for i in range(m):
        f_wb = w * x[i] + b
        cost = (f_wb - y[i]) ** 2
        cost_sum = cost_sum + cost
    total_cost = (1 / (2 * m)) * cost_sum

    return total_cost
定义代价函数,迭代求一组w,b中的cost,即
plt_intuition(x_train,y_train)x_train = np.array([1.0, 1.7, 2.0, 2.5, 3.0, 3.2])
y_train = np.array([250, 300, 480, 430, 630, 730,])换更大的数据集进行实验
plt.close('all')
fig, ax, dyn_items = plt_stationary(x_train, y_train)
updater = plt_update_onclick(fig, ax, x_train, y_train, dyn_items)
plt_stationary(x_train, y_train)返回三个变量:fig是一个 Figure 对象,表示 Matplotlib 中的绘图窗口;ax是一个 Axes 对象,表示图中的坐标轴;dyn_items是一个包含动态元素的 tuple (元组)。
plt_update_onclick(fig, ax, x_train, y_train, dyn_items)生成了一个更新函数updater来响应通过鼠标点击图形窗口所产生的事件,并将其链接到绘图对象fig和ax上。该函数还通过传递参数x_train、y_train和dyn_items将图形和原始数据链接起来,以便响应事件时,可以动态地更新数据并重新绘制图形。
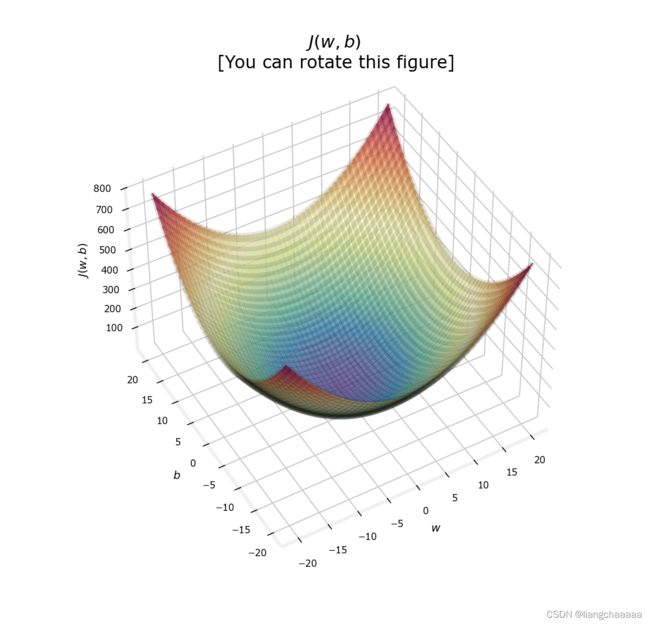
soup_bowl()w = 200, b = 0, cost = 1736, it is near theminimum (w = 209, b = 2.4)
Lib03 Gradient_Descent
数据导入与代价函数的计算在Lib02已经完成,这里不再赘述
# x_train = []
# y_train = []
# with open('input.txt','r',encoding='UTF-8') as f:
# content = f.readlines()
# for line in content:
# line = line.split(',')
# y_train.append(line[0])
# x_train.append(line[1])
# x_train = np.ndarray(x_train)
# y_train = np.ndarray(y_train)
x_train = np.array([1.0, 1.7, 2.0, 2.5, 3.0, 3.2])
y_train = np.array([250, 300, 480, 430, 630, 730,])输入六组数据测试,也可用文件输入
#计算对w,b的偏导数
def compute_gradient(x, y, w, b):
    """
    Computes the gradient for linear regression
    Args:
      x (ndarray (m,)): Data, m examples
      y (ndarray (m,)): target values
      w,b (scalar)    : model parameters
    Returns
      dj_dw (scalar): The gradient of the cost w.r.t. the parameters w
      dj_db (scalar): The gradient of the cost w.r.t. the parameter b
     """

    # Number of training examples
    m = x.shape[0]
    dj_dw = 0
    dj_db = 0

    for i in range(m):
        f_wb = w * x[i] + b
        dj_dw_i = (f_wb - y[i]) * x[i]
        dj_db_i = f_wb - y[i]
        dj_db += dj_db_i
        dj_dw += dj_dw_i
    dj_dw = dj_dw / m
    dj_db = dj_db / m

    return dj_dw, dj_db
计算偏导数的函数,对w和对b的偏导数学公式如上图
下面是推导过程
plt_gradients(x_train,y_train, compute_cost, compute_gradient)
plt.show()
Let's use our `compute_gradient` function to find and plot some partial derivatives of our cost function relative to one of the parameters,
.
可以利用 plt_gradients函数寻找并绘制成本函数相对于其中一个参数w0的一些偏导数
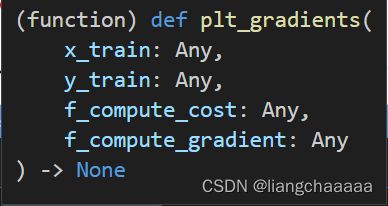
plt_gradients函数原型:
def gradient_descent(x, y, w_in, b_in, alpha, num_iters, cost_function, gradient_function):
    """
    Performs gradient descent to fit w,b. Updates w,b by taking
    num_iters gradient steps with learning rate alpha

    Args:
      x (ndarray (m,))  : Data, m examples
      y (ndarray (m,))  : target values
      w_in,b_in (scalar): initial values of model parameters
      alpha (float):     Learning rate
      num_iters (int):   number of iterations to run gradient descent
      cost_function:     function to call to produce cost
      gradient_function: function to call to produce gradient

    Returns:
      w (scalar): Updated value of parameter after running gradient descent
      b (scalar): Updated value of parameter after running gradient descent
      J_history (List): History of cost values
      p_history (list): History of parameters [w,b]
      """

    w = copy.deepcopy(w_in) # avoid modifying global w_in
    # An array to store cost J and w's at each iteration primarily for graphing later
    J_history = []
    p_history = []
    b = b_in
    w = w_in

    for i in range(num_iters):
        # Calculate the gradient and update the parameters using gradient_function
        dj_dw, dj_db = gradient_function(x, y, w , b)

        # Update Parameters using equation (3) above
        b = b - alpha * dj_db
        w = w - alpha * dj_dw

        # Save cost J at each iteration
        if i<100000:      # prevent resource exhaustion
            J_history.append( cost_function(x, y, w , b))
            p_history.append([w,b])
        # Print cost every at intervals 10 times or as many iterations if < 10
        if i% math.ceil(num_iters/10) == 0:
            print(f"Iteration {i:4}: Cost {J_history[-1]:0.2e} ",
                  f"dj_dw: {dj_dw: 0.3e}, dj_db: {dj_db: 0.3e}  ",
                  f"w: {w: 0.3e}, b:{b: 0.5e}")

    return w, b, J_history, p_history #return w and J,w history for graphing
官方梯度下降函数,J_history记录每次迭代的cost值,p_history记录每次迭代选取的w和b值,迭代num_iters次,每次修改w,b的值
# initialize parameters
w_init = 0
b_init = 0
# some gradient descent settings
iterations = 10000
tmp_alpha = 1.0e-2
# run gradient descent
w_final, b_final, J_hist, p_hist = gradient_descent(x_train ,y_train, w_init, b_init, tmp_alpha,
                                                    iterations, compute_cost, compute_gradient)
print(f"(w,b) found by gradient descent: ({w_final:8.4f},{b_final:8.4f})")
w,b初始化为0,迭代10000次,学习速率α设为0.01
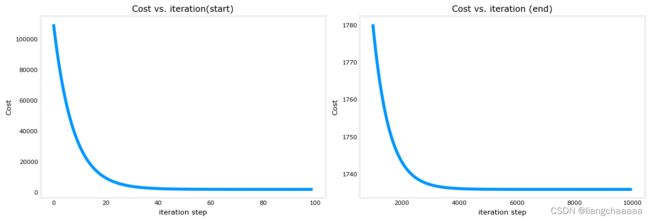
# plot cost versus iteration
fig, (ax1, ax2) = plt.subplots(1, 2, constrained_layout=True, figsize=(12,4))
ax1.plot(J_hist[:100])
ax2.plot(1000 + np.arange(len(J_hist[1000:])), J_hist[1000:])
ax1.set_title("Cost vs. iteration(start)");  ax2.set_title("Cost vs. iteration (end)")
ax1.set_ylabel('Cost')            ;  ax2.set_ylabel('Cost')
ax1.set_xlabel('iteration step')  ;  ax2.set_xlabel('iteration step')
plt.show()画图观察迭代前后代价函数的图像
print(f"1000 sqft house prediction {w_final*1.0 + b_final:0.1f} Thousand dollars")
print(f"1200 sqft house prediction {w_final*1.2 + b_final:0.1f} Thousand dollars")
print(f"2000 sqft house prediction {w_final*2.0 + b_final:0.1f} Thousand dollars")
利用梯度下降算法得到的w,b进行预测
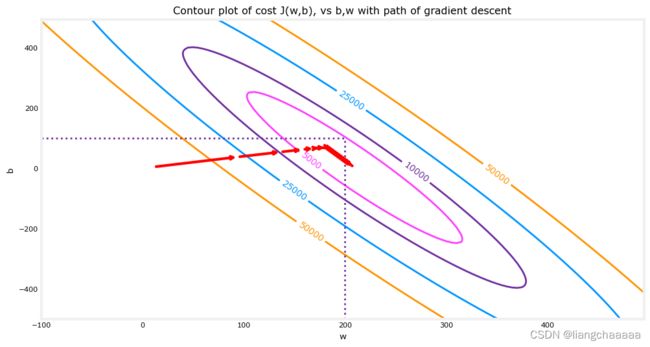
以下是一些数据的可视化,红色箭头的梯度下降的过程
