Python Matplotlib 子图
目录
1、绘制多个子图
2、绘图在指定的子图上
3、subplots命令:快速生成多个子图框架
3.1 快速布局
3.2 画一个图形
3.3 多个图形共用一个轴
3.4 与seaborn联合使用
3.5 使用数组方式指定子图
3.6 嵌套图
在matplotlib中,所有的绘图操作实际上都是以Axes对象为独立的绘图区域进行,在一个Figure对象中可以有多个子图,这些子图可以叠加存在,从而形成图中图效果。
1、绘制多个子图
subplot命令:可以将figure对象分为多个区域,每个区域分别放置一个Axes对象进行绘图。
matplotlib.pyplot.subplot(
nrows / ncols = 1 #: 图组的行/列数。
    #整个Figure对象区域被划分为nrows行 * ncols列。
    #然后按照从左到右、从上到下的顺序对每个区域进行编号,左上区域的编号为1。
index #: 指定所创建Axes对象所在的区域。
)
#如果numRows、numCols和Index三个参数都小于10,则可以把它们缩写成一个整数。
#subplot(323)和subplot(3,2,3)的含义相同。
子图区域设置
from matplotlib import pyplot as plt
plt.subplot(221) # 前面两个参数分别表示行和列,即将figure分为2行2列的区域,该图形的位置为第一行的左图
plt.subplot(222) # 第一行的右图
plt.subplot(212) # 第二整行
plt.plot([1,2,2,1]) #图形绘制在最后一个子图上
plt.show()
绘制结果如下:

2、绘图在指定的子图上
指定图表显示位置,即指定要画的图形显示在指定的子图上。
plt.subplot(221)
ax1 = plt.subplot(222)
plt.subplot(212)
plt.sca(ax1)
plt.plot([1,2,2,1]) #这样图形就显示在第二个子图中
plt.show()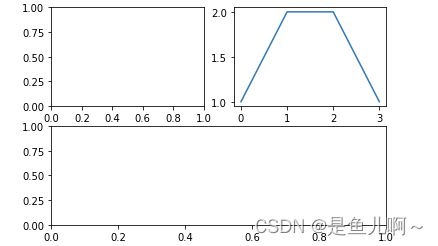
3、subplots命令:快速生成多个子图框架
subplots中参数描述,可以设置图形的个数,以及图形展示是否共用轴等。
matplotlib.pyplot.subplots(
nrows /ncols = 1 #: 图形网格的行/列数

sharex, sharey = False #: 在图组中是否共用行/列坐标轴
    #True or ‘all’: 对应的单元格都将共用行/列坐标轴
    #False or ‘none’: 各单元格独立设定行/列坐标轴
    #‘row’: 同一行的单元格将共用行/列坐标轴
    #‘col’: 同一列的单元格将共用行/列坐标轴
squeeze = True #: 是否尽量简化返回的Axes对象
    #False时即使只有一个单元格,也返回二维数组

subplot_kw #: dict, 未来调用add_subplot()建立子图时需要传送的参数
) #返回值:
    #fig : matplotlib.figure.Figure对象
    #ax : Axes对象/Axes数组对象
3.1 快速布局
fig, axes = plt.subplots(2, 3)
3.2 画一个图形
import seaborn as sns
fig, ax0 = plt.subplots()
sns.distplot([1,2,4,9,4,3,5], ax = ax0) # 此处ax参数也可以不指定
ax0.set_title('Sample plot')
3.3 多个图形共用一个轴
f, (ax1, ax2) = plt.subplots(1, 2, sharey = True)#共用列坐标轴
ax1.hist([200,300,500,900])
ax1.set_title('Sharing Y axis')
ax2.plot([0,200,300])
3.4 与seaborn联合使用
# 与seaborn联合使用
f, (ax1, ax2) = plt.subplots(1, 2)
sns.boxplot(y = [200,500,600], ax = ax1)
ax1.set_title('1')
sns.boxplot(y = [300,700,800], ax = ax2)
ax2.set_title('2')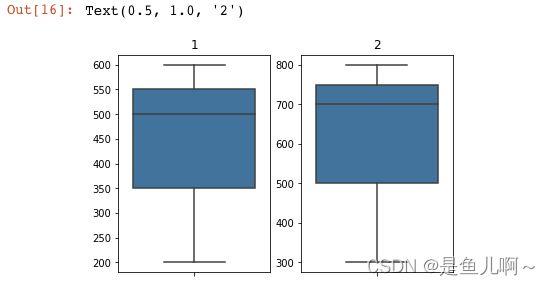
3.5 使用数组方式指定子图
# 使用数组方式指定子图
fig, axes = plt.subplots(2, 2)
sns.boxplot(y = [200,500,600], ax = axes[0, 0])
sns.boxplot(y = [300,700,800], ax = axes[1, 1]) 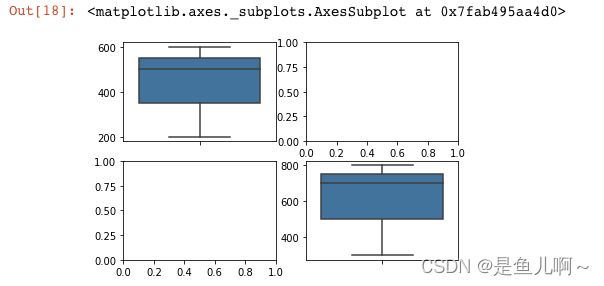
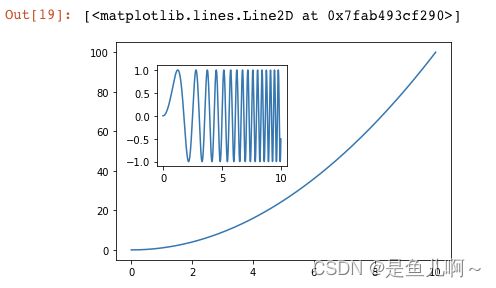
3.6 嵌套图
#嵌套图
import numpy as np

x = np.linspace(0,10,1000)
y2 = np.sin(x**2)
y1 = x**2

fig,ax1 = plt.subplots()

left,bottom,width,height = [0.22,0.45,0.3,0.35]
ax2 = fig.add_axes([left,bottom,width,height])

ax1.plot(x,y1)
ax2.plot(x,y2)