Qt读写Excel–QXlsx插入图表5
文章目录
- Qt读写Excel--QXlsx插入图表5
-
- @[toc]
- 1、概述
- 2、准备工作
- 3、函数说明
- 4、示例代码
-
- 5、实现效果
- 6、源代码
1、概述
2、准备工作
Qt读写Excel–QXlsx基本使用1 |
Qt读写Excel–QXlsx编译为静态库2 |
3、函数说明
注意:执行了操作要保存才生效。⛔
-
Chart *Document::insertChart(int row, int col, const QSize &size) |
- 功能说明: 在当前工作表第row行col列单元格【右下角位置】插入一个大小为size的图表;
- 参数row: 插入图表的左上角位于row行;
- 参数col: 插入图表的左上角位于col行;
- 参数size: 图表的大小;
- 返回值:返回指向刚插入的图表的指针;
-
void Chart::setChartType(ChartType type) |
- 功能说明: 设置图表的类型;
- 参数type: Chart::ChartType枚举定义的16种图表类型,其中部分类型还不支持;
-
void Chart::addSeries(const CellRange &range, AbstractSheet *sheet, bool headerH, bool headerV, bool swapHeaders) |
- 功能说明: 为图表添加用于显示的数据系列;
- 参数range: 添加数据的范围,例如:CellRange(“A1:C9”)表示添加第一列A1到C9的数据;
- 参数sheet: 添加的数据位于哪一个工作表,默认为当前工作表;
- 参数headerH: 数据系列范围第一行是否为列标题,true:为标题,默认为false;
- 参数headerV: 数据系列范围第1列是否为行标题,true:为标题,默认为false;
- 参数swapHeaders: true:交换行列标头;
-
void Chart::setChartLegend(Chart::ChartAxisPos legendPos, bool overlay) |
- 功能说明: 设置图表图例的位置;
- 参数legendPos: 图例位置,由Chart::ChartAxisPos枚举定义,可设置None:无图例, Left:左边, Right:右边, Top:上边, Bottom:下边;
- 参数overlay: 图例是否会被图表遮挡,true:被遮挡,默认为false。
-
void Chart::setChartTitle(QString strchartTitle) |
- 功能说明: 设置图表的标题;
- 参数strchartTitle: 需要设置的标题内容。
-
void Chart::setGridlinesEnable(bool majorGridlinesEnable, bool minorGridlinesEnable) |
- 功能说明: 是否开启图表的网格线;
- 参数majorGridlinesEnable: true:启动主网格线,默认为false;
- 参数minorGridlinesEnable: true:启动次网格线,默认为false;
4、示例代码
4.1 .h文件
#ifndef TEST4_H
#define TEST4_H
#include
#include "Interface.h"
namespace Ui {
class Test4;
}
class Test4 :public InterFace
{
Q_OBJECT
public:
explicit Test4(QWidget *parent = nullptr);
~Test4();
QString getExcelName() override;
private slots:
void on_pushButton_clicked();
void on_pushButton_2_clicked();
void on_pushButton_3_clicked();
private:
Ui::Test4 *ui;
};
#endif
4.2 .cpp文件
#include "test4.h"
#include "ui_test4.h"
#include
#include
#include
#include
#include
#include
QXLSX_USE_NAMESPACE
#define EXCEL_NAME "chart.xlsx"
Test4::Test4(QWidget *parent) :
InterFace(parent),
ui(new Ui::Test4)
{
ui->setupUi(this);
this->setWindowTitle("QXlsx在工作表中插入所有支持的图表、插入图表Sheet");
this->setToolTip(this->windowTitle());
}
Test4::~Test4()
{
delete ui;
}
QString Test4::getExcelName()
{
return EXCEL_NAME;
}
void Test4::on_pushButton_clicked()
{
Document xlsx;
for(int i = 1; i < 10; i++)
{
xlsx.write(i, 1, i * i * i);
xlsx.write(i, 2, i * i);
xlsx.write(i, 3, i *i - 1);
}
qDebug() << CellReference(1, 2).toString();
xlsx.write(3, 4, "CT_AreaChart");
Chart* areaChart = xlsx.insertChart(3, 3, QSize(300, 300));
areaChart->setChartType(Chart::CT_AreaChart);
areaChart->addSeries(CellRange("A1:C9"));
xlsx.write(3, 10, "CT_Area3DChart");
Chart *area3DChart = xlsx.insertChart(3, 9, QSize(300, 300));
area3DChart->setChartType(Chart::CT_Area3DChart);
area3DChart->addSeries(CellRange("A1:C9"));
xlsx.write(3, 16, "CT_LineChart");
Chart* lineChart = xlsx.insertChart(3, 15, QSize(300, 300));
lineChart->setChartType(Chart::CT_LineChart);
lineChart->addSeries(CellRange("A1:C9"));
xlsx.write(23, 4, "CT_Line3DChart");
Chart* line3DChart = xlsx.insertChart(23, 3, QSize(300, 300));
line3DChart->setChartType(Chart::CT_Line3DChart);
line3DChart->addSeries(CellRange("A1:C9"));
xlsx.write(23, 10, "CT_StockChart");
Chart* stockChart = xlsx.insertChart(23, 9, QSize(300, 300));
stockChart->setChartType(Chart::CT_StockChart);
stockChart->addSeries(CellRange("A1:C9"));
xlsx.write(23, 16, "CT_RadarChart");
Chart* radarChart = xlsx.insertChart(23, 15, QSize(300, 300));
radarChart->setChartType(Chart::CT_RadarChart);
radarChart->addSeries(CellRange("A1:A9"));
xlsx.write(43, 4, "CT_ScatterChart");
Chart* scatterChart = xlsx.insertChart(43, 3, QSize(300, 300));
scatterChart->setChartType(Chart::CT_ScatterChart);
scatterChart->addSeries(CellRange("A1:A9"));
scatterChart->addSeries(CellRange("B1:B9"));
scatterChart->addSeries(CellRange("C1:C9"));
xlsx.write(43, 10, "CT_PieChart");
Chart* pieChart = xlsx.insertChart(43, 9, QSize(300, 300));
pieChart->setChartType(Chart::CT_PieChart);
pieChart->addSeries(CellRange("A1:A9"));
pieChart->addSeries(CellRange(CellReference(1, 2), CellReference(9, 2)));
pieChart->addSeries(CellRange(1, 3, 9, 3));
xlsx.write(43, 16, "CT_Pie3DChart");
Chart* pie3DChart = xlsx.insertChart(43, 15, QSize(300, 300));
pie3DChart->setChartType(Chart::CT_Pie3DChart);
pie3DChart->addSeries(CellRange("A1:A9"));
xlsx.write(63, 4, "CT_DoughnutChart");
Chart* doughnutChart = xlsx.insertChart(63, 3, QSize(300, 300));
doughnutChart->setChartType(Chart::CT_DoughnutChart);
doughnutChart->addSeries(CellRange("A1:A9"));
xlsx.write(63, 10, "CT_BarChart");
Chart* barChart = xlsx.insertChart(63, 9, QSize(300, 300));
barChart->setChartType(Chart::CT_BarChart);
barChart->addSeries(CellRange("A1:A9"));
xlsx.write(63, 16, "CT_Bar3DChart");
Chart* bar3DChart = xlsx.insertChart(63, 15, QSize(300, 300));
bar3DChart->setChartType(Chart::CT_Bar3DChart);
bar3DChart->addSeries(CellRange("A1:A9"));
xlsx.write(83, 4, "CT_OfPieChart");
Chart* ofPieChart = xlsx.insertChart(83, 3, QSize(300, 300));
ofPieChart->setChartType(Chart::CT_OfPieChart);
ofPieChart->addSeries(CellRange("A1:A9"));
xlsx.write(83, 10, "CT_SurfaceChart");
Chart* surfaceChart = xlsx.insertChart(83, 9, QSize(300, 300));
surfaceChart->setChartType(Chart::CT_SurfaceChart);
surfaceChart->addSeries(CellRange("A1:A9"));
xlsx.write(83, 16, "CT_Surface3DChart");
Chart* surface3DChart = xlsx.insertChart(83, 15, QSize(300, 300));
surface3DChart->setChartType(Chart::CT_Surface3DChart);
surface3DChart->addSeries(CellRange("A1:A9"));
xlsx.write(103, 4, "CT_BubbleChart");
Chart* bubbleChart = xlsx.insertChart(103, 3, QSize(300, 300));
bubbleChart->setChartType(Chart::CT_BubbleChart);
bubbleChart->addSeries(CellRange("A1:A9"));
if(xlsx.saveAs(EXCEL_NAME))
{
qInfo() << "插入所有图表Demo保存成功!";
}
else
{
qWarning() << "插入所有图表Demo保存失败!";
}
}
void Test4::on_pushButton_2_clicked()
{
Document xlsx;
for(int i = 1; i < 10; i++)
{
xlsx.write(1, i + 1, QString("Pos %1").arg(i));
xlsx.write(2, i + 1, i * i * i);
xlsx.write(3, i + 1, i * i);
}
xlsx.write(2, 1, "Set 1");
xlsx.write(3, 1, "Set 2");
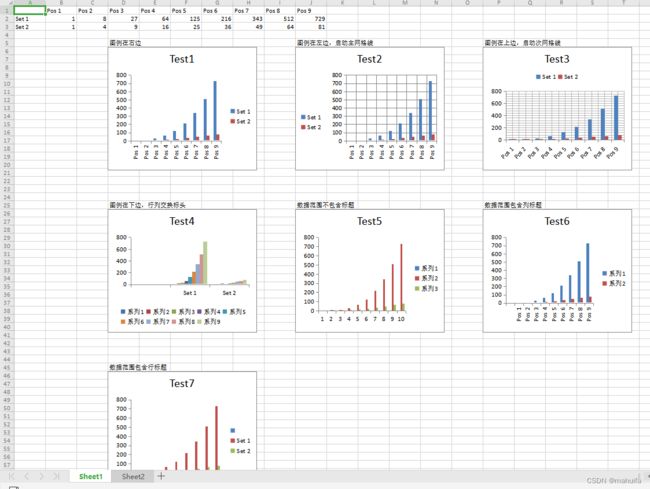
xlsx.write(5, 4, "图例在右边");
Chart* barChart1 = xlsx.insertChart(5, 3, QSize(300, 300));
barChart1->setChartType(Chart::CT_BarChart);
barChart1->setChartLegend(Chart::Right);
barChart1->setChartTitle("Test1");
barChart1->addSeries(CellRange(1, 1, 3, 10), nullptr, true, true, false);
xlsx.write(5, 10, "图例在左边,启动主网格线");
Chart* barChart2 = xlsx.insertChart(5, 9, QSize(300, 300));
barChart2->setChartType(Chart::CT_BarChart);
barChart2->setChartLegend(Chart::Left);
barChart2->setChartTitle("Test2");
barChart2->setGridlinesEnable(true);
barChart2->addSeries(CellRange(1, 1, 3, 10), nullptr, true, true, false);
xlsx.write(5, 16, "图例在上边,启动次网格线");
Chart* barChart3 = xlsx.insertChart(5, 15, QSize(300, 300));
barChart3->setChartType(Chart::CT_BarChart);
barChart3->setChartLegend(Chart::Top);
barChart3->setChartTitle("Test3");
barChart3->setGridlinesEnable(false, true);
barChart3->addSeries(CellRange(1, 1, 3, 10), nullptr, true, true, false);
xlsx.write(25, 4, "图例在下边,行列交换标头");
Chart* barChart4 = xlsx.insertChart(25, 3, QSize(300, 300));
barChart4->setChartType(Chart::CT_BarChart);
barChart4->setChartLegend(Chart::Bottom);
barChart4->setChartTitle("Test4");
barChart4->addSeries(CellRange(1, 1, 3, 10), nullptr, false, true, true);
xlsx.write(25, 10, "数据范围不包含标题");
Chart* barChart5 = xlsx.insertChart(25, 9, QSize(300, 300));
barChart5->setChartType(Chart::CT_BarChart);
barChart5->setChartLegend(Chart::Right);
barChart5->setChartTitle("Test5");
barChart5->addSeries(CellRange(1, 1, 3, 10));
xlsx.write(25, 16, "数据范围包含列标题");
Chart* barChart6 = xlsx.insertChart(25, 15, QSize(300, 300));
barChart6->setChartType(Chart::CT_BarChart);
barChart6->setChartLegend(Chart::Right);
barChart6->setChartTitle("Test6");
barChart6->addSeries(CellRange(1, 1, 3, 10), nullptr, true);
xlsx.write(45, 4, "数据范围包含行标题");
Chart* barChart7 = xlsx.insertChart(45, 3, QSize(300, 300));
barChart7->setChartType(Chart::CT_BarChart);
barChart7->setChartLegend(Chart::Right);
barChart7->setChartTitle("Test7");
barChart7->addSeries(CellRange(1, 1, 3, 10), nullptr, false, true);
xlsx.addSheet("Sheet2");
xlsx.write(3, 4, "插入图表,引用Sheet1数据");
Chart* barChart8 = xlsx.insertChart(3, 3, QSize(300, 300));
barChart8->setChartType(Chart::CT_BarChart);
barChart8->setChartLegend(Chart::Right);
barChart8->setChartTitle("Test8");
barChart8->addSeries(CellRange(1, 1, 3, 10), xlsx.sheet("Sheet1"));
if(xlsx.saveAs(EXCEL_NAME))
{
qInfo() << "保存成功!";
}
else
{
qWarning() << "保存失败!";
}
}
void Test4::on_pushButton_3_clicked()
{
Document xlsx;
for(int i = 1; i < 10; i++)
{
xlsx.write(i, 1, i * i);
}
xlsx.addSheet("Chart1", AbstractSheet::ST_ChartSheet);
Chartsheet* sheet = static_cast<Chartsheet*>(xlsx.currentSheet());
Chart* barChart = sheet->chart();
barChart->setChartType(Chart::CT_BarChart);
barChart->addSeries(CellRange("A1:A9"), xlsx.sheet("Sheet1"));
if(xlsx.saveAs(EXCEL_NAME))
{
qInfo() << "保存成功!";
}
else
{
qWarning() << "保存失败!";
}
}
5、实现效果
6、源代码
gitee
github