echarts实现排名柱状图
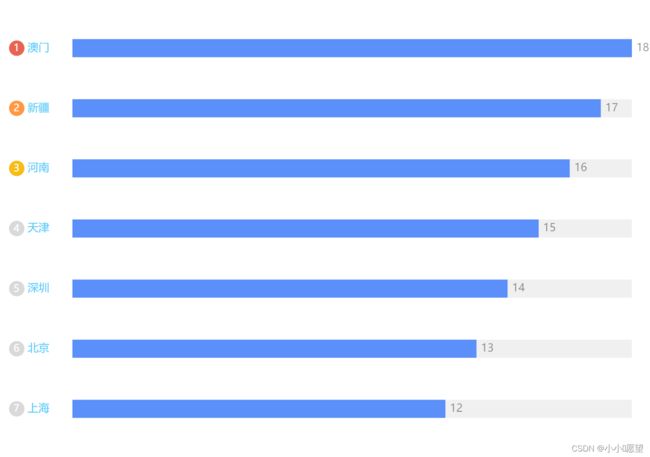
通过echarts实现排名柱状图,效果图如下,下方是完整代码,可以直接在echarts示例中运行。在线运行
let ydata = ['上海', '北京', '深圳', '天津', '河南', '新疆', '澳门'];
let xdata = [12, 13, 14, 15, 16, 17, 18];
option = {
  tooltip: {
    trigger: "axis",
  },
  grid: {
    left: "80",
    right: "20",
    bottom: "20",
    top: "20",
    containLabel: false,
  },
  xAxis: {
    type: "value",
    show: false,
  },
  yAxis: {
    type: "category",
    data: ydata,
    axisLine: {
      show: false,
    },
    axisTick: {
      show: false,
    },
    axisLabel: {
      margin: 70,
      width: 60,
      align: "left",
      overflow: "truncate",
      formatter: function (value, index) {
        let ind = index + 1;
        if (ind == ydata.length) {
          return "{one|" + (ydata.length - index) + "} {a|" + value + "}";
        } else if (ind + 1 == ydata.length) {
          return "{two|" + (ydata.length - index) + "} {b|" + value + "}";
        } else if (ind + 2 == ydata.length) {
          return (
            "{three|" + (ydata.length - index) + "} {c|" + value + "}"
          );
        }
        if (ydata.length - index > 9) {
          return (
            "{five|" + (ydata.length - index) + "} {d|" + value + "}"
          );
        }
        return "{four|" + (ydata.length - index) + "} {d|" + value + "}";
      },
      rich: {
        a: {
          color: "#59c9f9",
        },
        b: {
          color: "#59c9f9",
        },
        c: {
          color: "#59c9f9",
        },
        d: {
          color: "#59c9f9",
        },
        // 第一名
        one: {
          backgroundColor: "#E86452",
          color: "white",
          width: 12,
          height: 16,
          padding: [1, 0, 0, 5],
          borderRadius: 10,
          fontSize: 11,
        },
        // 第二名
        two: {
          backgroundColor: "#FF9845",
          color: "white",
          width: 12,
          height: 16,
          padding: [1, 0, 0, 5],
          borderRadius: 10,
          fontSize: 11,
        },
        // 第三名
        three: {
          backgroundColor: "#F6BD16",
          color: "white",
          width: 12,
          height: 16,
          padding: [1, 0, 0, 5],
          borderRadius: 10,
          fontSize: 11,
        },
        // 一位数
        four: {
          backgroundColor: "rgba(0,0,0,0.15)",
          color: "white",
          width: 12,
          height: 16,
          padding: [1, 0, 0, 5],
          borderRadius: 10,
          fontSize: 11,
        },
        // 两位数
        five: {
          backgroundColor: "rgba(0,0,0,0.15)",
          color: "white",
          width: 16,
          height: 16,
          padding: [1, 0, 0, 1],
          borderRadius: 10,
          fontSize: 11,
        },
      },
    },
  },
  series: [{
    type: "bar",
    showBackground: true,
    label: {
      show: true,
      position: "right",
      color: "rgba(0,0,0,0.45)",
    },
    barWidth: 20,
    itemStyle: {
      color: "#5B8FF9",
    },
    data: xdata,
  }, ],
};