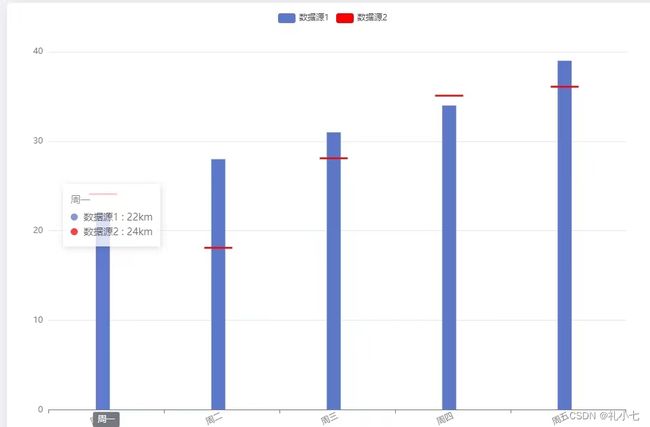
echarts标靶图开发
let msgTimes = ['周一','周二','周三','周四','周五']
let lineColors = [0.2,0.2,0.2,0.2,0.2] //红色柱子
let tabCarList = [22,28,31,34,39]
let transverseLineList = [24,18,28,35,36]
option = {
         legend: {
          data: ['数据源1', '数据源2'],
          selectedMode: false
        },
        xAxis: {
          type: 'category',
          axisLabel: {
            rotate: 25
          },
          axisPointer: {
            type: 'none'
          },
          splitArea: {
            show: false
          },
          splitLine: {
            show: false
          },
          data: [...msgTimes]
        },
        tooltip: {
          trigger: 'axis',
          axisPointer: {
            type: 'cross'
          },
          formatter: function(params) {
            const res = `
                ${params[0].name}
            ${params[0].marker} ${params[0].seriesName} : ${params[0].data !== null ? params[0].data + 'km' : '-'}
            ${params[2].marker} ${params[2].seriesName} : ${params[1].data !== null ? params[1].data + 'km' : '-'}
            `
            return res
          }
        },
        grid: {
          left: '3%',
          right: '4%',
          bottom: '3%',
          containLabel: true
        },
        yAxis: {
          type: 'value',
          axisPointer: {
            show: false
          },
          axisLabel: {
            formatter: '{value}'
          }
        },
        series: [
          {
            name: '数据源1',
            data: tabCarList,
            type: 'bar',
            barMaxWidth: 20,
            markLine: {
              symbol: 'none',
              itemStyle: {
                normal: {
                  color: '#FA8565',
                  label: {
                    show: false
                  }
                }
              }
            }
            // connectNulls: true
          },
          {
            name: '123',
            stack: 'breakevenEleGroup',
            type: 'bar',
            barGap: '-150%',
            barMaxWidth: 20,
            itemStyle: {
              normal: {
                color: 'rgba(0,0,0,0)'
              }
            },
            data: transverseLineList
          },
          {
            name: '数据源2',
            stack: 'breakevenEleGroup', // 数据组,需要设置才能将两个bar堆积在一起*/
            type: 'bar',
            barMaxWidth: 40,
            barGap: '-150%',
            z: 999,
            itemStyle: {
              normal: {
                color: 'red'
              }
            },
            data: lineColors
          }
        ]
      };