数字图像处理 第六章 彩色图像处理
第六章 彩色图像处理
- 一、彩色基础
-
- 物理性质
- 消色与彩色光
- 人眼传感器
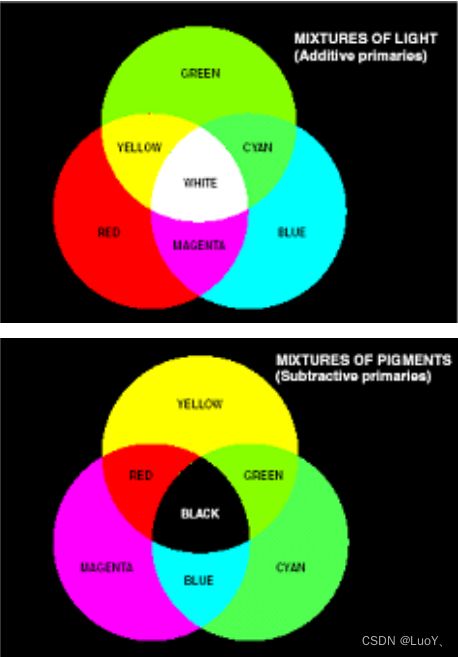
- 原色和合成色
- 颜色特征
- 二、彩色模型
-
- 2.1RGB彩色模型
-
- 2.1.1RGB示意图
- 2.2CMY和CMYK彩色模型
- 2.3HSI颜色模型
-
- 2.3.1HSI颜色空间
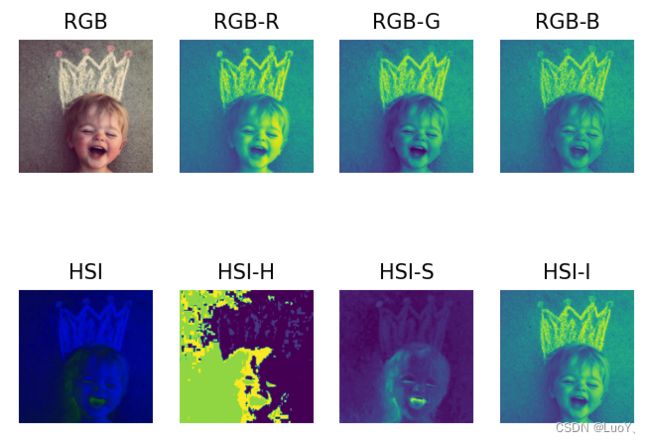
- 2.2.2Python实现RGB和HSI颜色空间的转换
- 三、伪彩色图像处理
-
- 3.1灰度分层
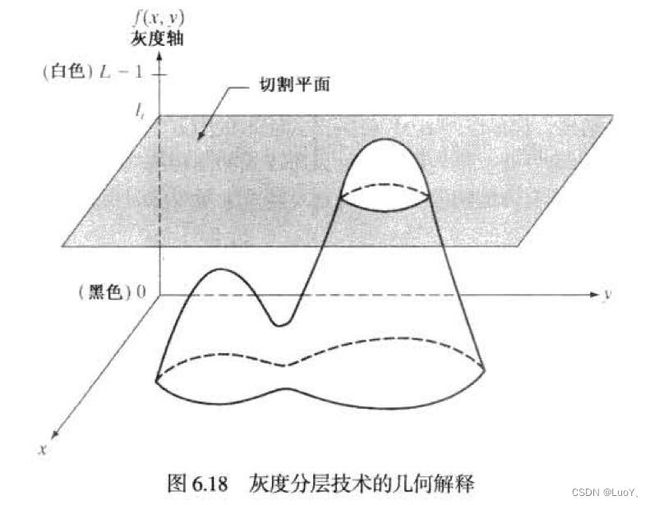
- 3.2灰度分层技术的几何解释
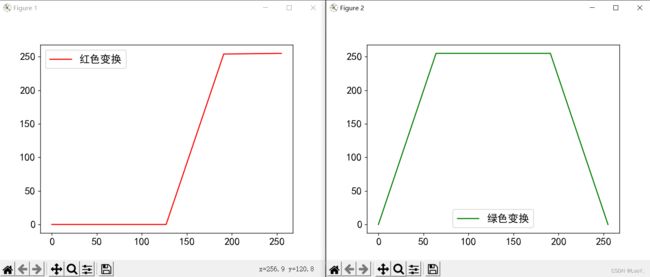
- 3.3Python实现灰度值到彩色变换
- 四、全彩色图像处理基础
- 五、彩色变换
-
- 5.1公式
- 5.2补色
- 5.3彩色分层
- 5.4亮度和色度校正
-
- 5.4.1亮度校正
- 5.4.3彩色平衡
- 六、平滑和锐化
-
- 6.1彩色图像平滑
- 6.2Python实现图像平滑
- 6.3Python实现图像锐化
- 七、彩色图像的噪声
一、彩色基础
物理性质
大脑感知和理解颜色所遵循的过程是一种未完全了解的生理心理现象。
色谱可分为6个较宽的区域:紫色、蓝色、绿色、黄色、橙色和红色。如下图所示:
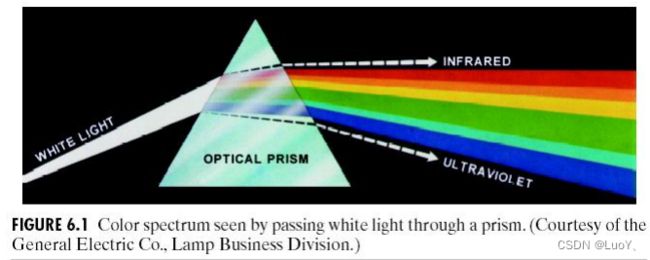
可见范围电磁波波长如下图所示:
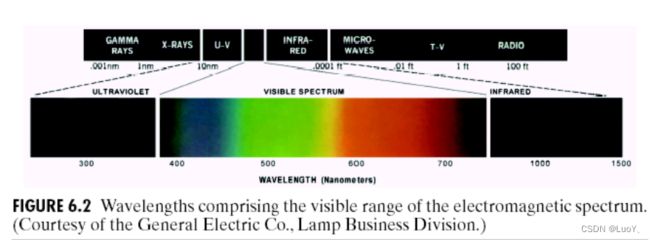
一个物体的颜色由物体反射光的性质决定。
消色与彩色光
如果光是消色的,它的属性仅仅是亮度。灰度仅提供一个度量亮度的标量,它的范围从黑到灰最后到白。彩色光覆盖400 到700 nm电磁波谱。
彩色光源质量用3个基本量描述:
1、辐射率Radiance: 从光源流出能量的总量,通常用瓦特度量 (W)。
2、光强Luminance: 观察者从光源接收的能量总和的度量,用流明度量。
3、亮度Brightness: 主观描绘子,实际上不可能度量,包含了无色的强度概念。
人眼传感器
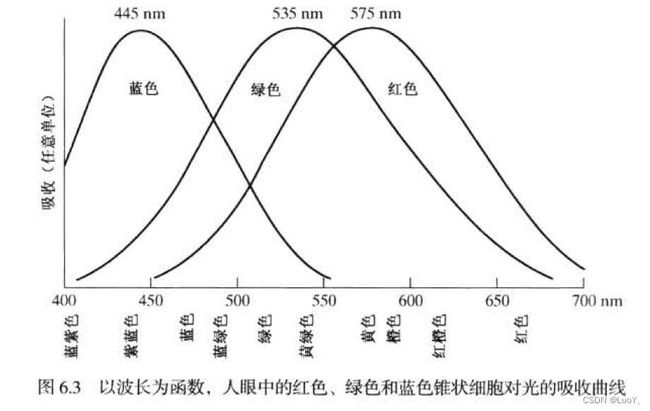
人眼的锥状细胞是负责彩色视觉的传感器,分为3个主要的感觉类别,分别对应红、绿和蓝。下图显示了人眼中的红色、绿色、和蓝色锥状细胞吸收光的平均实验曲线。
原色和合成色
颜色特征
1、亮度Brightness :无色的强度;
2、色调Hue:光波混合中与主波长有关的属性,表示观察者接收的主要颜色;
3、饱和度Saturation :与所加白光数量成反比。
色调和饱和度一起称为色度,因此颜色可用其亮度和色度来表征。形成任何特殊彩色的红、绿、蓝的数量称为三色值,并分别表示为X、Y和Z。这样,一种颜色就可由其三色值系数定义为:
x = X X + Y + Z x=\frac{X}{X+Y+Z} x=X+Y+ZX
y = Y X + Y + Z y=\frac{Y}{X+Y+Z} y=X+Y+ZY
和 z = Z X + Y + Z z=\frac{Z}{X+Y+Z} z=X+Y+ZZ
从以上公式可得 x + y + z = 1 x+y+z=1 x+y+z=1
二、彩色模型
彩色模型又称彩色空间或彩色系统。彩色模型使用坐标系统和子空间的表达,位于系统中的每种颜色都由单个点来表示。
RGB (red, green, blue)模型:彩色监视器和彩色视频摄像机
CMY (cyan, magenta, yellow)模型:彩色打印机
HSI (hue, saturation, intensity) 模型:符合人描述和解释颜色的方式
2.1RGB彩色模型
2.1.1RGB示意图
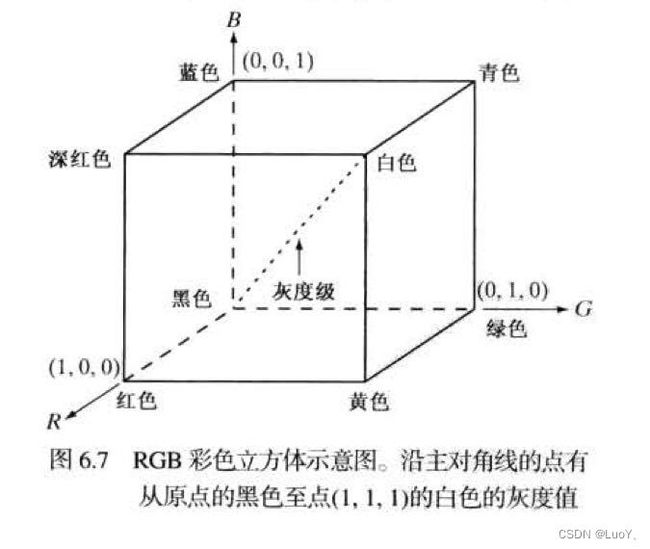
RGB彩色立方体示意图:
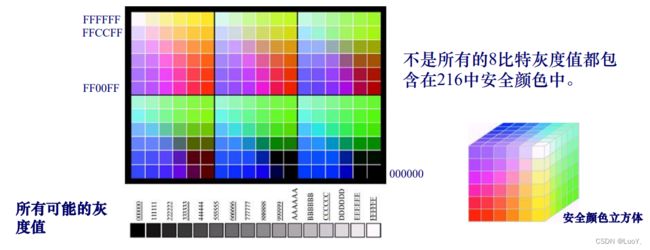
RGB24比特彩色立方体:
2.1.2Python实现RGB通道分离
import cv2

img = cv2.imread("demo.jpg")
b,g,r = cv2.split(img)
imgb = img.copy()
imgg = img.copy()
imgr = img.copy()

def b(imgb):
    imgb[:,:,1]=0
    imgb[:,:,2]=0
    return imgb

def g(imgg):
    imgg[:,:,0]=0
    imgg[:,:,2]=0
    return imgg

def r(imgr):
    imgr[:,:,0]=0
    imgr[:,:,1]=0
    return imgr

def main():
    cv2.imshow("b",b(imgb))
    cv2.imshow("g",g(imgg))
    cv2.imshow("r",r(imgr))
    cv2.waitKey(0)
    cv2.destroyAllWindows()

if __name__ == '__main__':
    main()
2.2CMY和CMYK彩色模型
颜料原色:青、品红、黄
[ C M Y ] = [ 1 1 1 ] − [ R B G ] \begin{bmatrix}C\\ M\\ Y\end{bmatrix}=\begin{bmatrix}1\\ 1\\1\end{bmatrix}-\begin{bmatrix}R\\ B\\ G \end{bmatrix} ⎣ ⎡CMY⎦ ⎤=⎣ ⎡111⎦ ⎤−⎣ ⎡RBG⎦ ⎤
打印时等量的青,品红和黄色产生的黑色是不纯的,因此需要CMYK彩色模型。
2.3HSI颜色模型
RGB,CMY颜色模型不能很好地适应实际上人解释的颜色。当人观察一个彩色物体时,用色调、色饱和度和亮度来描述。
2.3.1HSI颜色空间
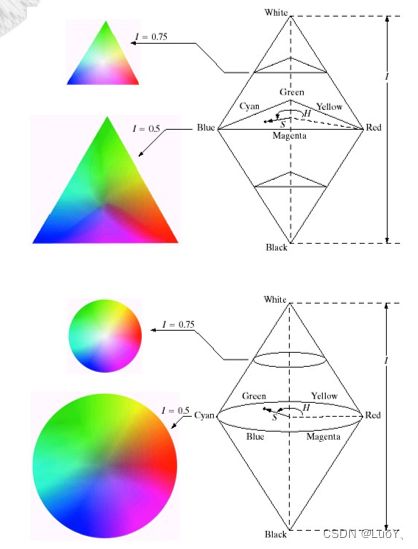
与红轴的夹角是 色调,向量的长 度是饱和度,垂 直轴为强度轴。
2.2.2Python实现RGB和HSI颜色空间的转换
from skimage import data, io
from matplotlib import pyplot as plt
import math
import numpy as np
import sys


# 定义RGB图像转换为HSI图像的函数
def RGB_to_HSI(r, g, b):
    r = r / 255
    g = g / 255
    b = b / 255
    num = 0.5 * ((r - g) + (r - b))
    den = ((r - g) * (r - g) + (r - b) * (g - b)) ** 0.5
    if b <= g:
        if den == 0:
            den = sys.float_info.min
        h = math.acos(num / den)
    elif b > g:
        if den == 0:
            den = sys.float_info.min
        h = (2 * math.pi) - math.acos(num / den)
    s = 1 - (3 * min(r, g, b) / (r + g + b))
    i = (r + g + b) / 3
    return int(h), int(s * 100), int(i * 255)


image = io.imread('demo.jpg')
#image = data.coffee()
hsi_image = np.zeros(image.shape, dtype='uint8')
for ii in range(image.shape[0]):
    for jj in range(image.shape[1]):
        r, g, b = image[ii, jj, :]
        h, s, i = RGB_to_HSI(r, g, b)
        hsi_image[ii, jj, :] = (h, s, i)

# 显示RGB原图像
plt.subplot(2, 4, 1)
plt.imshow(image)
plt.axis('off')
plt.title('RGB')

# 显示RGB原图像R分量
plt.subplot(2, 4, 2)
plt.imshow(image[:, :, 0])
plt.axis('off')
plt.title('RGB-R')

# 显示RGB原图像G分量
plt.subplot(2, 4, 3)
plt.imshow(image[:, :, 1])
plt.axis('off')
plt.title('RGB-G')

# 显示RGB原图像B分量
plt.subplot(2, 4, 4)
plt.imshow(image[:, :, 2])
plt.axis('off')
plt.title('RGB-B')

# 显示HSI原图像
plt.subplot(2, 4, 5)
plt.imshow(hsi_image)
plt.axis('off')
plt.title('HSI')

# 显示HSI图像H分量
plt.subplot(2, 4, 6)
plt.imshow(hsi_image[:, :, 0])
plt.axis('off')
plt.title('HSI-H')

# 显示HSI图像S分量
plt.subplot(2, 4, 7)
plt.imshow(hsi_image[:, :, 1])
plt.axis('off')
plt.title('HSI-S')

# 显示HSI图像I分量
plt.subplot(2, 4, 8)
plt.imshow(hsi_image[:, :, 2])
plt.axis('off')
plt.title('HSI-I')

plt.show()
三、伪彩色图像处理
伪彩色处理(又称假彩色)是根据特定的准则 对灰度值赋以彩色的处理。伪彩色的主要应用是为了人目视观察和解释一幅 图像或序列图像中的灰度目标。
3.1灰度分层
3.2灰度分层技术的几何解释
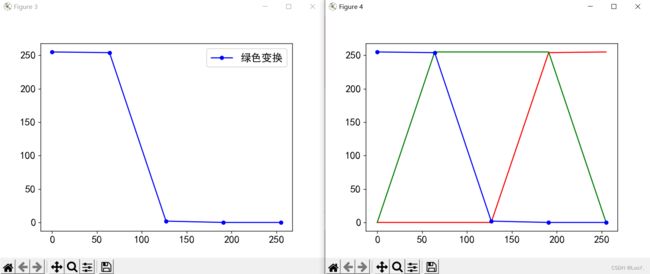
3.3Python实现灰度值到彩色变换
from skimage import data, color
from matplotlib import pyplot as plt
import numpy as np

L = 255


# 定义灰度值到彩色变换
def getR(gray):
    if gray < L / 2:
        return 0
    elif gray > L / 4 * 3:
        return L
    else:
        return 4 * gray - 2 * L


def getG(gray):
    if gray < L / 4:
        return 4 * gray
    elif gray > L / 4 * 3:
        return 4 * L - 4 * gray
    return L


def getB(gray):
    if gray < L / 4:
        return L
    elif gray > L / 2:
        return 0
    else:
        return 2 * L - 4 * gray


# 设置字体格式
plt.rcParams['font.sans-serif'] = ['SimHei']
plt.rcParams['font.size'] = 15
plt.rcParams['axes.unicode_minus'] = False
x = [0, 64, 127, 191, 255]

# 绘制灰度图像到R通道的映射关系
plt.figure()
R = []
for i in x:
    R.append(getR(i))
plt.plot(x, R, 'r', label='红色变换')
plt.legend(loc='best')

# 绘制灰度图像到R通道的映射关系
plt.figure()
G = []
for i in x:
    G.append(getG(i))
plt.plot(x, G, 'g', label='绿色变换')
plt.legend(loc='best')

# 绘制灰度图像到B通道的映射关系
plt.figure()
B = []
for i in x:
    B.append(getB(i))
plt.plot(x, B, 'b', marker='o', markersize='5', label='绿色变换')
plt.legend(loc='best')

# 绘制灰度图像到RGB的映射关系
plt.figure()
plt.plot(x, R, 'r')
plt.plot(x, G, 'g')
plt.plot(x, B, 'b', marker='o', markersize='5')

plt.show()
四、全彩色图像处理基础
全彩色图像处理方法:
1、分别处理每一个彩色分量图像,然后将处理结果合成
2、直接处理彩色图像
令c代表RGB颜色空间中的任意向量:
c ( x , y ) = [ c R ( x , y ) c B ( x , y ) c G ( x , y ) ] = [ R ( x , y ) G ( x , y ) B ( x , y ) ] c(x,y)=\begin{bmatrix}c_{R}(x,y)\\ c_{B}(x,y)\\ c_{G}(x,y) \end{bmatrix}=\begin{bmatrix}R(x,y)\\G(x,y) \\ B(x,y) \end{bmatrix} c(x,y)=⎣ ⎡cR(x,y)cB(x,y)cG(x,y)⎦ ⎤=⎣ ⎡R(x,y)G(x,y)B(x,y)⎦ ⎤
基于每一个彩色分量处理和基于向量的处理等同需满足:
1、理必须对标量和向量都是可用的
2、 对每一个分量的操作对于其他分量必须都是独立的
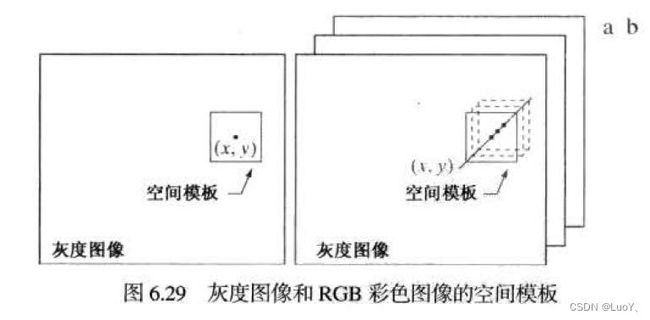
下图显示了灰度图像与全彩色图像的领域空间处理:
五、彩色变换
5.1公式
彩色变换公式:
g ( x , y ) = T [ f ( x , y ) ] g(x,y)=T[f(x,y)] g(x,y)=T[f(x,y)]
f ( x , y ) f(x,y) f(x,y)是彩色输入图像。
另外一种形式表示是:
s i = T i ( r 1 , r 2 , . . . , r n ) , i = 1 , 2 , . . . , n s_{i}=T_{i}(r_{1},r_{2},...,r_{n}),i=1,2,...,n si=Ti(r1,r2,...,rn),i=1,2,...,n
如果是RBG颜色空间,则 n = 3 n=3 n=3, r 1 , r 2 和 r 3 r_{1},r_{2}和r_{3} r1,r2和r3表示红,绿和蓝。CMYK时, n = 4 n=4 n=4。HSI时, n = 3 n=3 n=3。
5.2补色
在彩色环上与一种色调直接对立的另一种颜色称为补色。补色对于增强嵌在彩色图像暗区的细节,特别是在大小上占支配地位的细节很有用。
5.3彩色分层
突出图像中特殊的彩色区域对从其周围 分离出目标物,或使用彩色定义的区域 作为模板用于进一步处理,是很用的。对一幅彩色图像分层的最简单的方法之一 是把某些感兴趣区域以外的彩色映射为不 突出的自然色。
对于W宽的立方体:
s i = { 0.5 [ ∣ r j − a j ∣ > W 2 ] 1 ≤ j ⩽ n r i 其他 s_{i}=\left\{\begin{matrix} 0.5 & [\left | r_{j}-a_{j}\right |> \frac{W}{2}]_{1\leq j\leqslant n} \\ r_{i} & 其他 \end{matrix}\right. si={0.5ri[∣rj−aj∣>2W]1≤j⩽n其他
对于半径为 R 0 R_{0} R0的球:
s i = { 0.5 ∑ j = 1 n ( r j − a j ) 2 > R 0 2 r i 其他 s_{i}=\left\{\begin{matrix} 0.5 & \sum_{j=1}^{n}(r_{j}-a_{j})^{2}> R_{0}^{2}\\ r_{i} & 其他 \end{matrix}\right. si={0.5ri∑j=1n(rj−aj)2>R02其他
5.4亮度和色度校正
在所用监视器和最终输出设备之间保持高度的彩色一致性是必要的。标定图像可以对亮度和不平衡的色度交互和独立校正。
5.4.1亮度校正
实验性地调整亮度对比度,以便在合适的亮度上 提供最大的细节,彩色本身并不改变。在RGB和CMY空间中,意味着用相同的亮度变换 函数映射3个彩色分量,而在HSI彩色空间中,则仅改变亮度分量。等量地调整R、G、B分量并不总能显著改变图像的色调。如下图所示: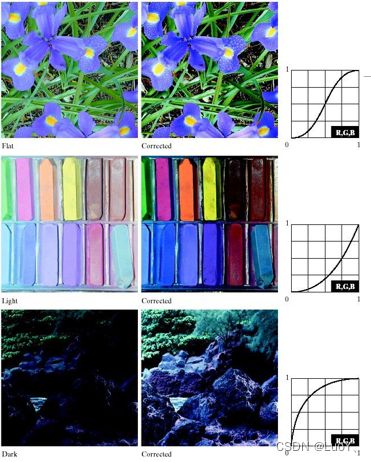
5.4.3彩色平衡
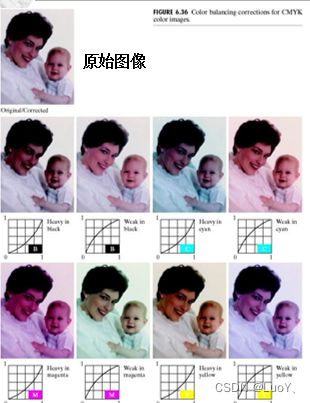
假定RBG图像中有过多的品红色,则可以移去红色和蓝色,增加绿色。如下图所示:
六、平滑和锐化
6.1彩色图像平滑
全彩色图像平滑处理等同灰度图像平滑处理,除用分量向量代替灰度标量值:
c ‾ ( x , y ) = 1 K ∑ ( s , t ) ∈ S x y c ( s , t ) \overline{c}(x,y)=\frac{1}{K}\sum _{(s,t)\in S_{xy}}c(s,t) c(x,y)=K1(s,t)∈Sxy∑c(s,t)
它遵循向量相加的性质。
使用邻域平均值平滑可以在每个彩色平面的基础上进行,其结果与用RGB彩色向量执行平均是相同的。
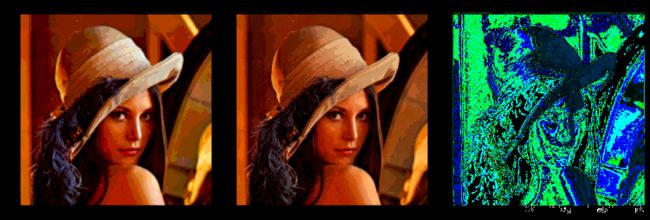
6.2Python实现图像平滑
# 图像平滑
mean_kernal = np.ones([5, 5])
mean_kernal = mean_kernal / (mean_kernal.size)

img_rgb_new = np.zeros(img_rgb.shape, np.uint8)

for i in range(3):
    img_temp = img_rgb[:, :, i]
    img_dst = arithmentic_mean(img_temp, kernel=mean_kernal)
    img_rgb_new[:, :, i] = img_dst

img_hsi_new = np.zeros(img_rgb.shape, np.uint8)

for i in range(3):
    if i == 2:
        img_temp = img_hsi[:, :, i]
        img_dst = arithmentic_mean(img_temp, kernel=mean_kernal)
        img_hsi_new[:, :, i] = img_dst
    else:
        img_hsi_new[:, :, i] = img_hsi[:, :, i]

img_hsi_rgb = cv2.cvtColor(img_hsi_new, cv2.COLOR_HSV2RGB)

img_diff = img_rgb_new - img_hsi_rgb

plt.figure(figsize=(15, 5))
plt.subplot(1, 3, 1), plt.imshow(img_rgb_new), plt.title('RGB')
plt.subplot(1, 3, 2), plt.imshow(img_hsi_rgb), plt.title('HSI RGB')
plt.subplot(1, 3, 3), plt.imshow(img_diff), plt.title('Differenc')

plt.tight_layout()
plt.show()
6.3Python实现图像锐化
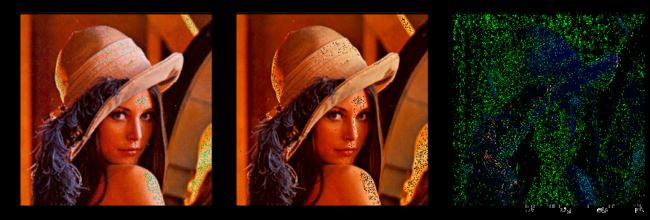
# 图像锐化
img_rgb_new = np.zeros(img_rgb.shape, np.uint8)

for i in range(3):
    img_temp = img_rgb[:, :, i]
    img_dst = laplacian_img(img_temp)
    img_rgb_new[:, :, i] = img_dst

img_hsi_new = np.zeros(img_rgb.shape, np.uint8)

for i in range(3):
    if i == 2:
        img_temp = img_hsi[:, :, i]
        img_dst = laplacian_img(img_temp)
        img_hsi_new[:, :, i] = img_dst
    else:
        img_hsi_new[:, :, i] = img_hsi[:, :, i]

img_hsi_rgb = cv2.cvtColor(img_hsi_new, cv2.COLOR_HSV2RGB)

img_diff = img_rgb_new - img_hsi_rgb

plt.figure(figsize=(15, 5))
plt.subplot(1, 3, 1), plt.imshow(img_rgb_new), plt.title('RGB')
plt.subplot(1, 3, 2), plt.imshow(img_hsi_rgb), plt.title('HSI RGB')
plt.subplot(1, 3, 3), plt.imshow(img_diff), plt.title('Differenc')

plt.tight_layout()
plt.show()
七、彩色图像的噪声
通常,彩色图像噪声的内容在每个彩色通道中具有相同的特性,但是可能对不同彩色通道造成不同的影响。
全彩色图像的噪声过滤可以基于每个图像或直接在颜色向量空间,这取决于过滤方法,例如均值滤波对RGB分量单独处理,而非线性的统计滤波不能直接用于HSI颜色空间或RGB分量。

通过上图可以看出单个RGB通 道受噪声影响会把噪声 扩散到HSI所有分量图像上。
